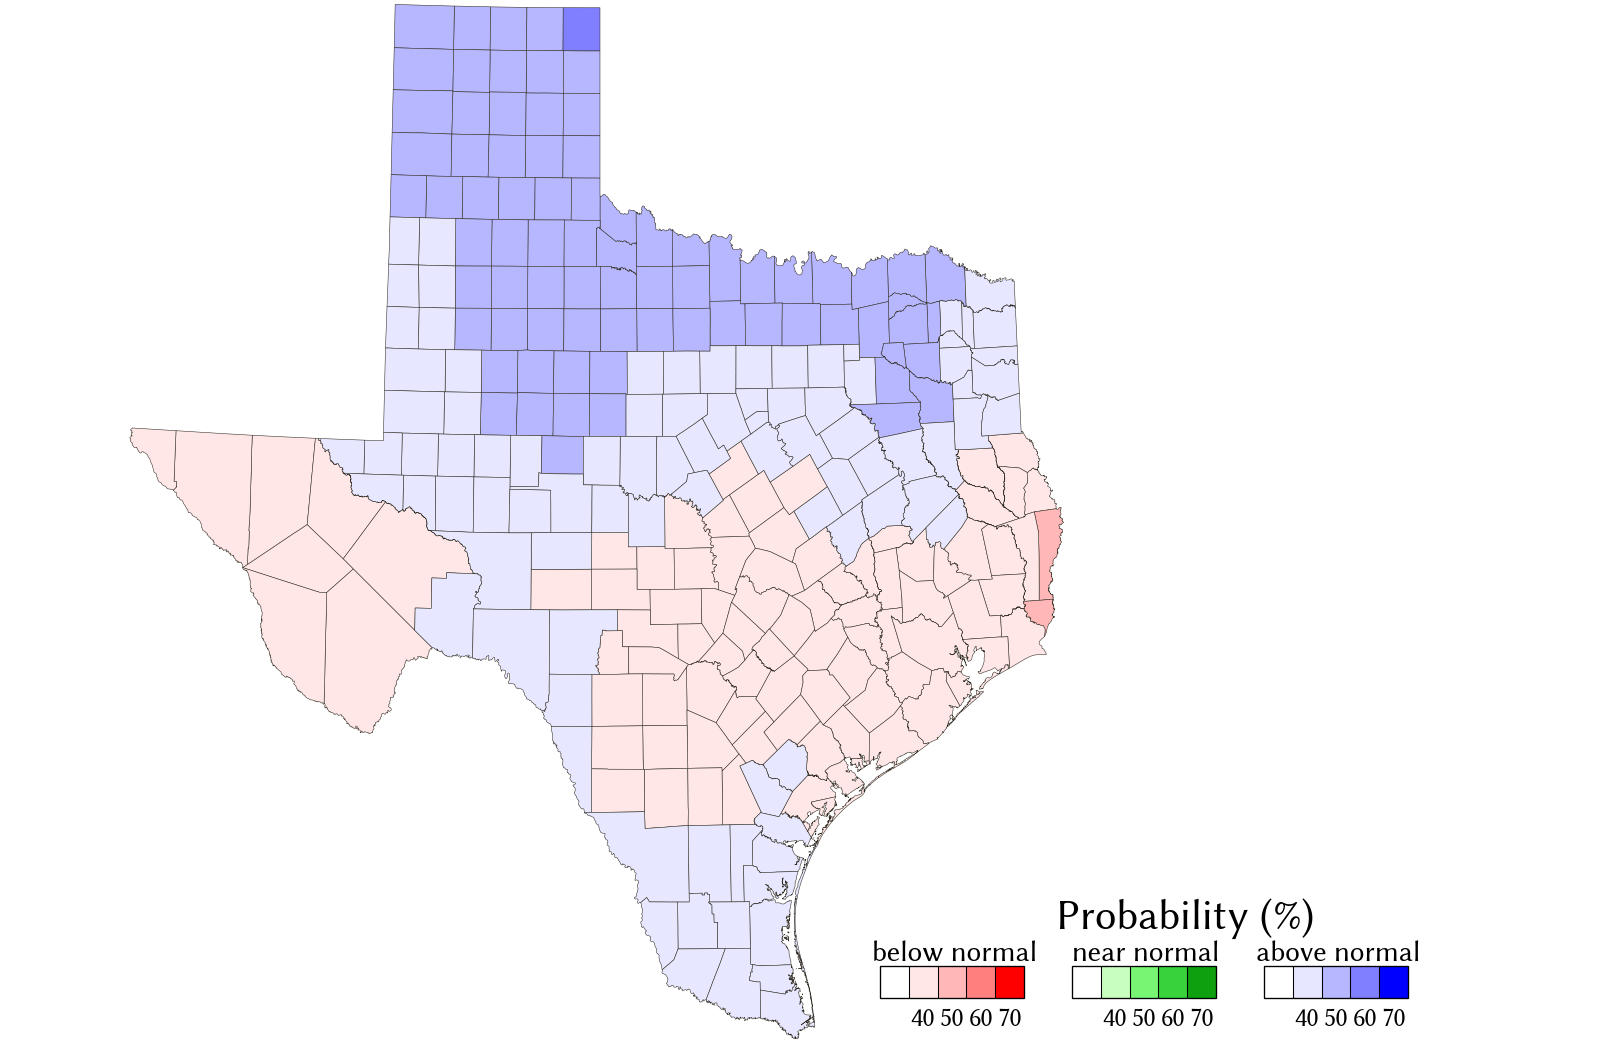
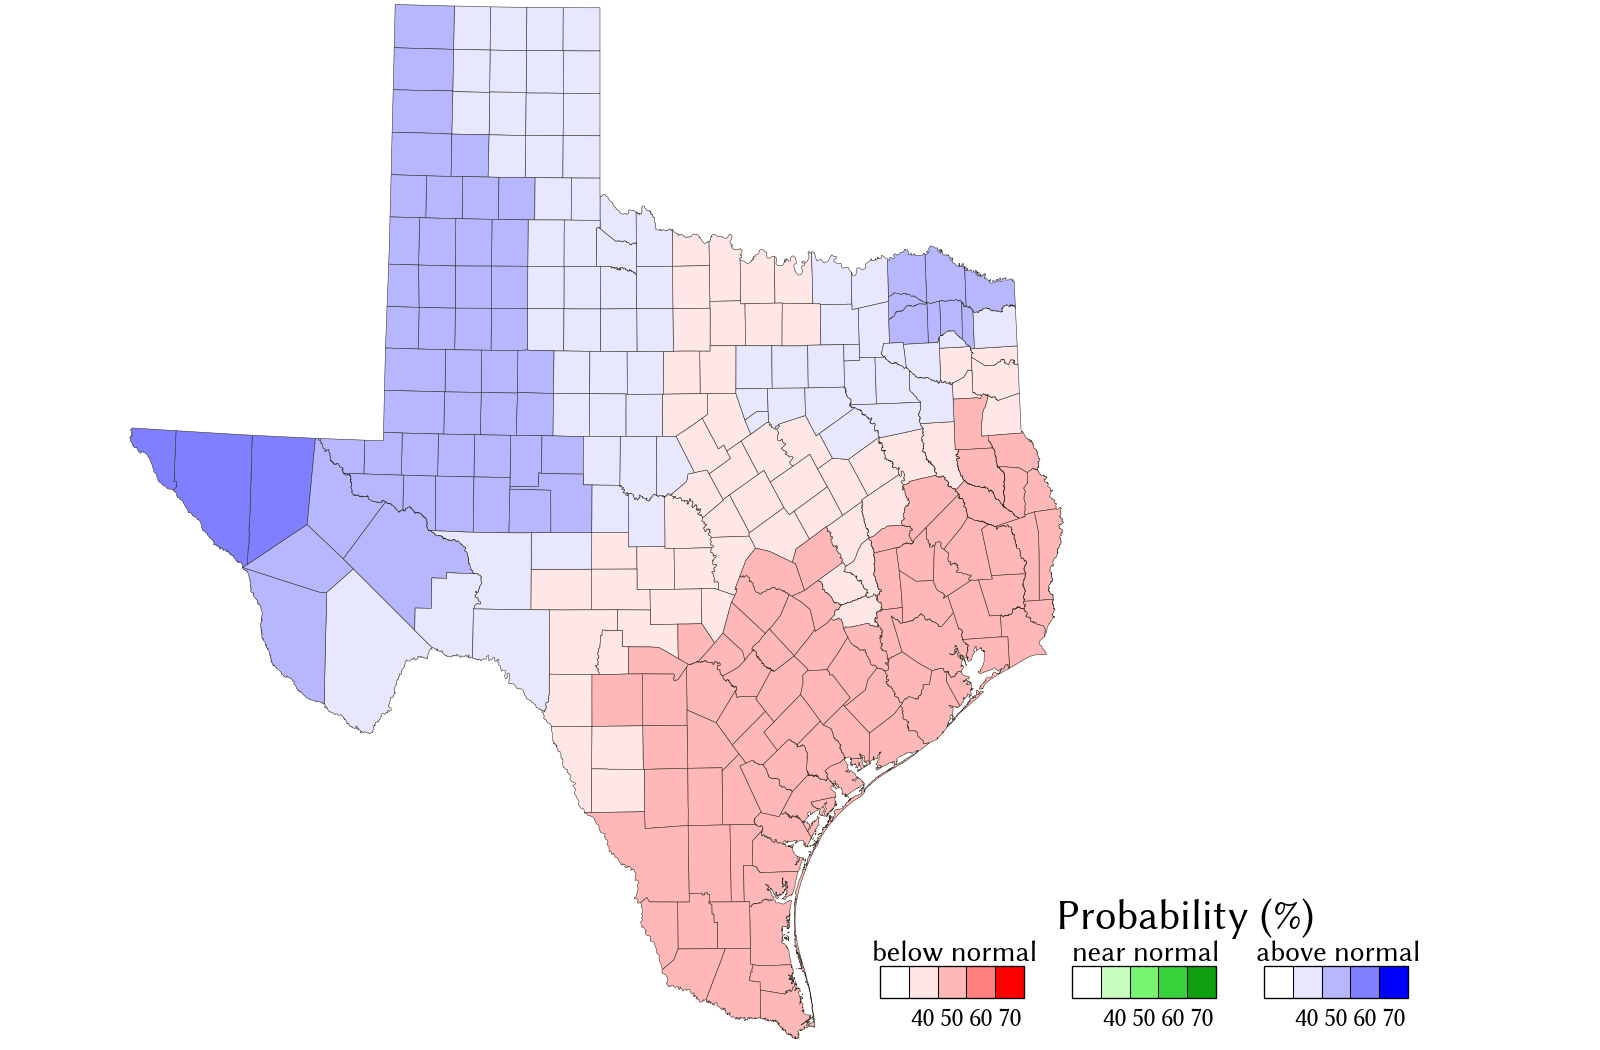
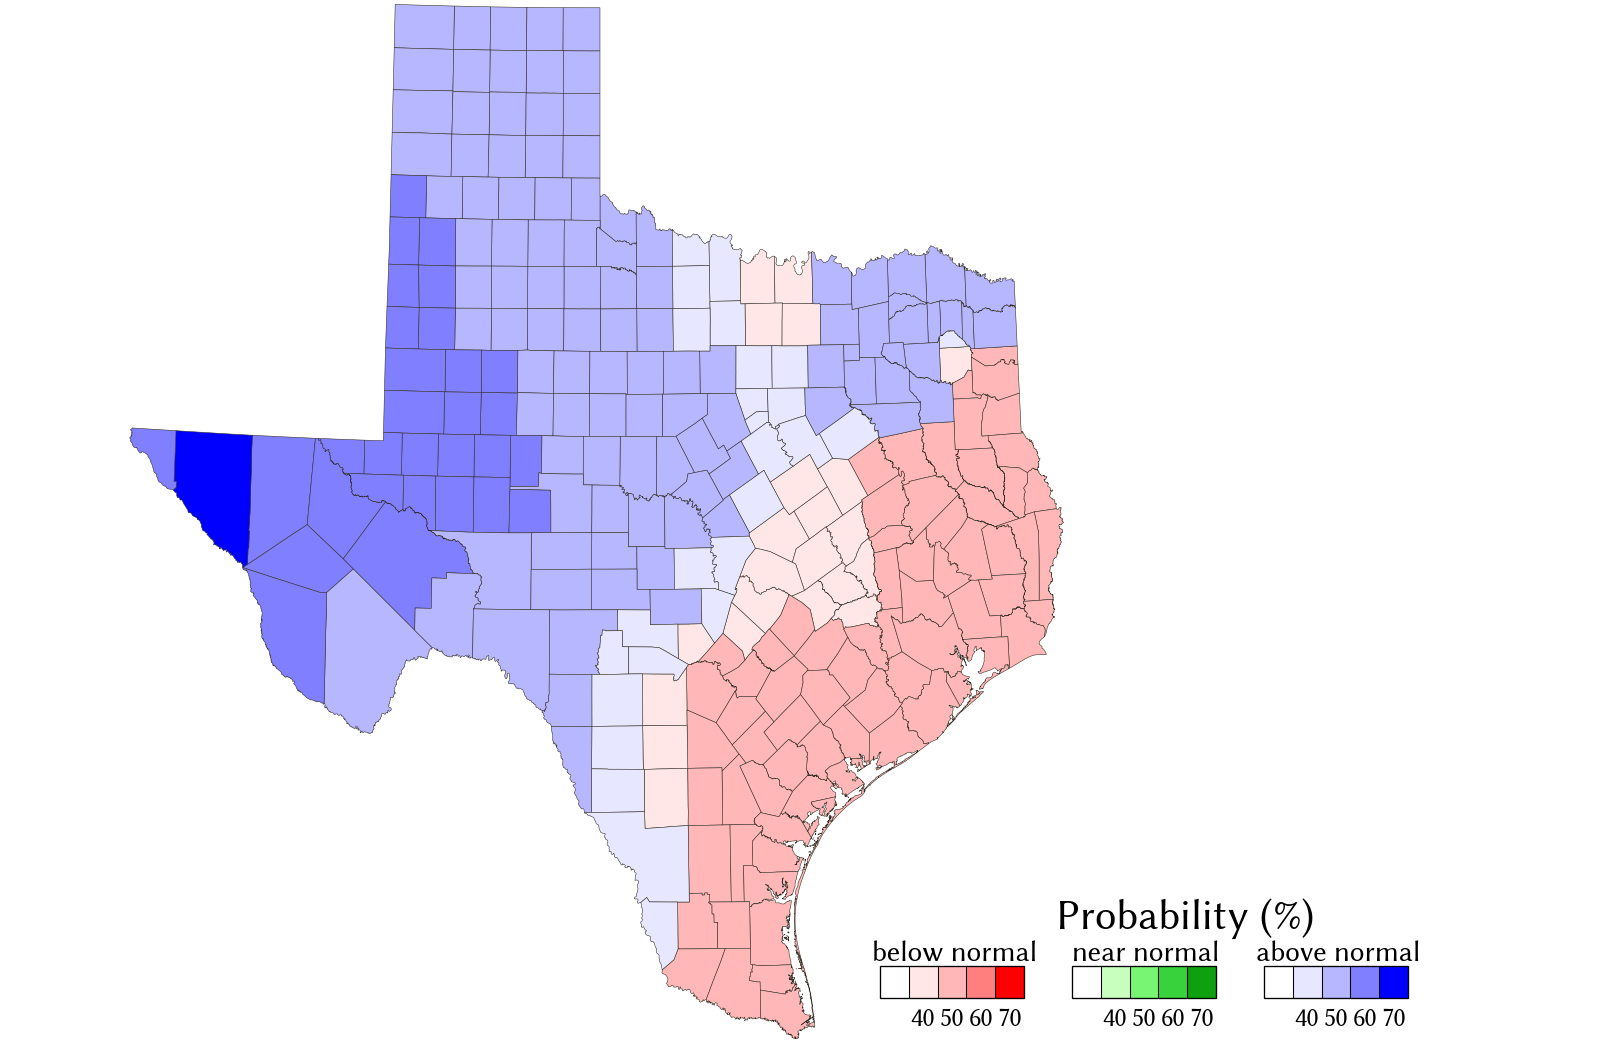
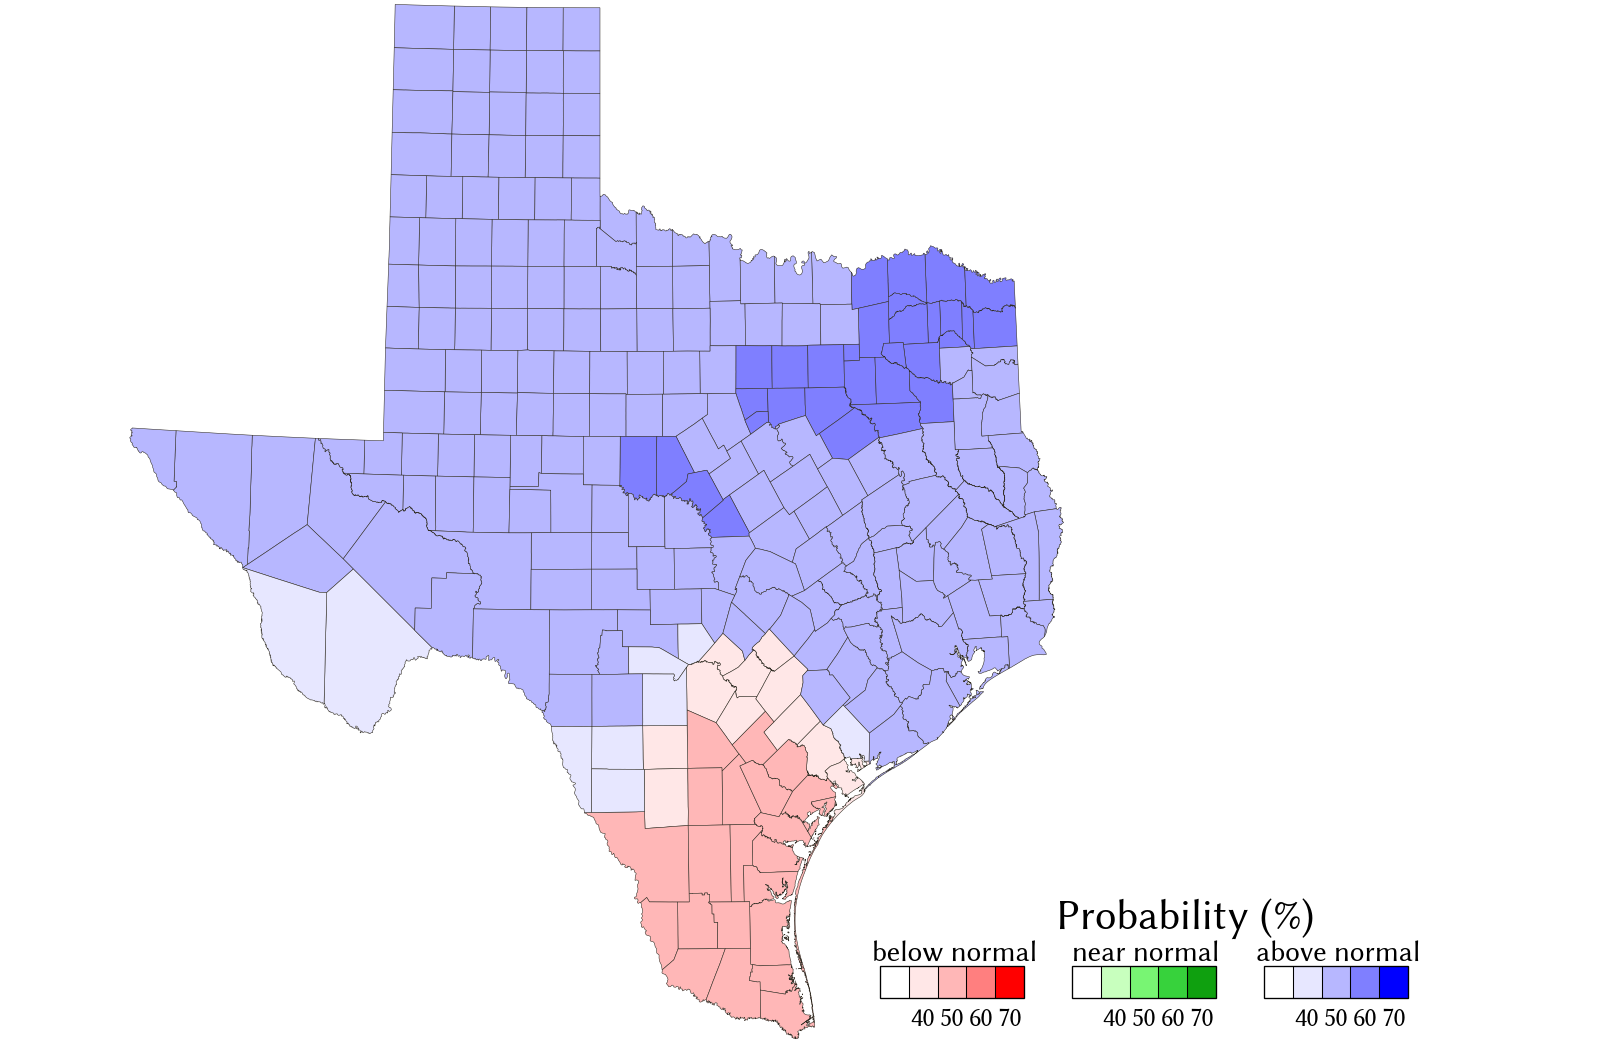
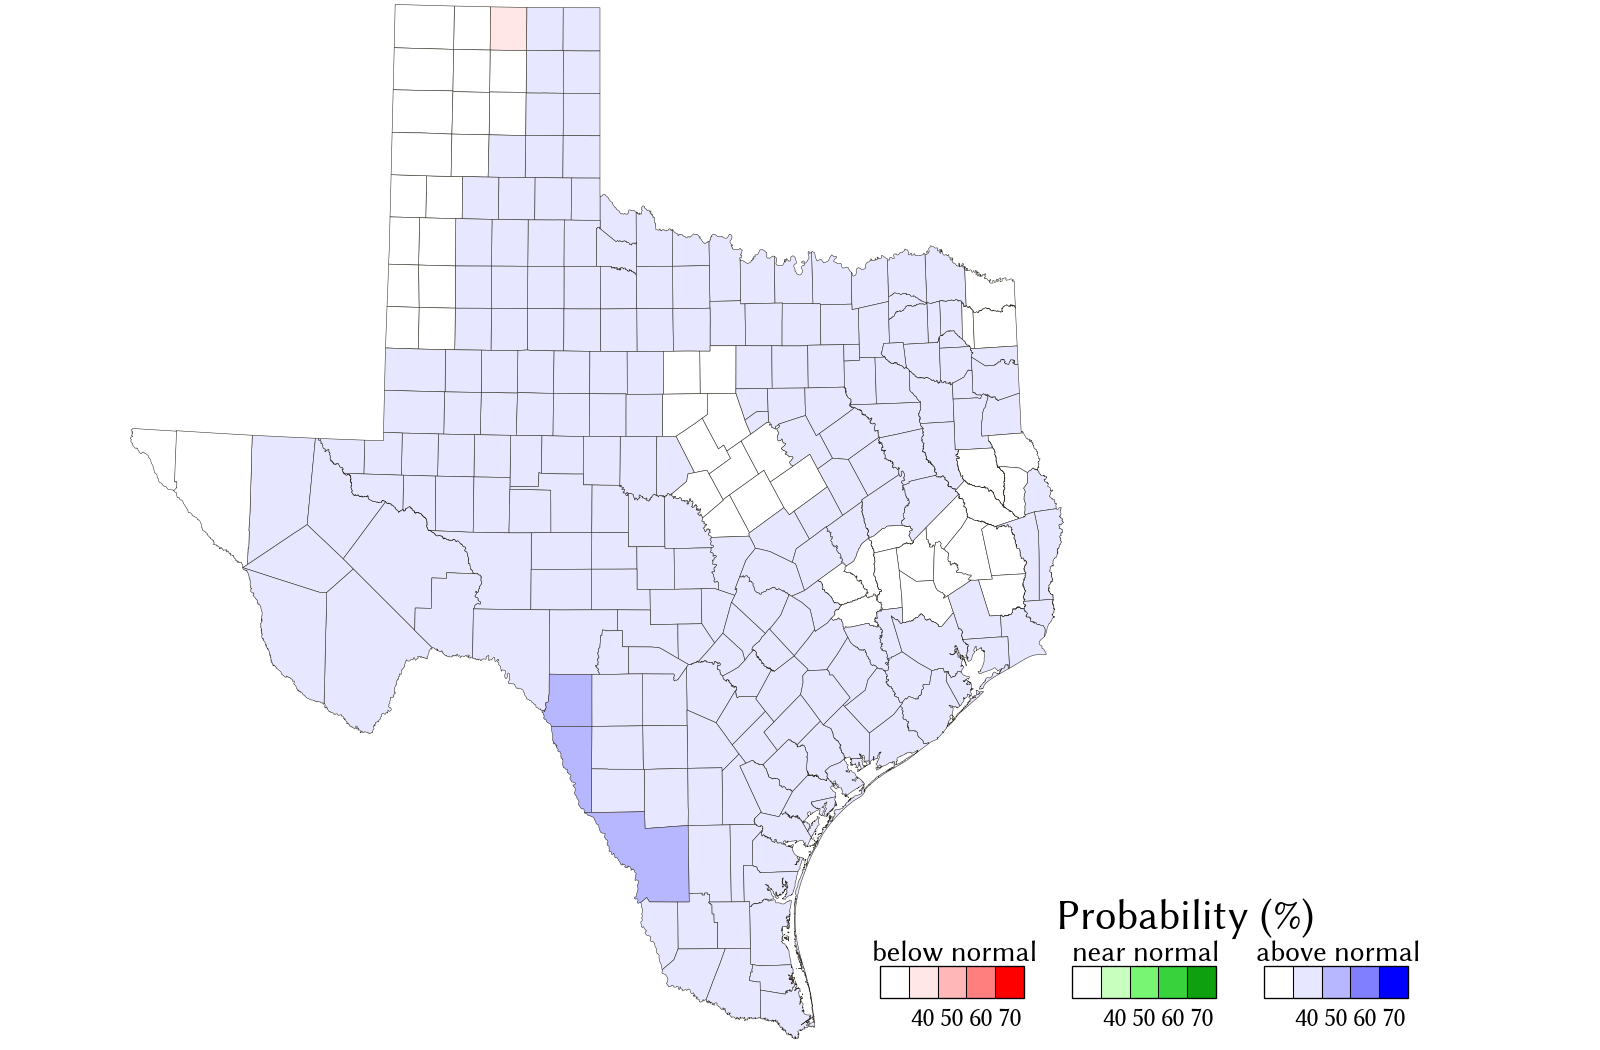
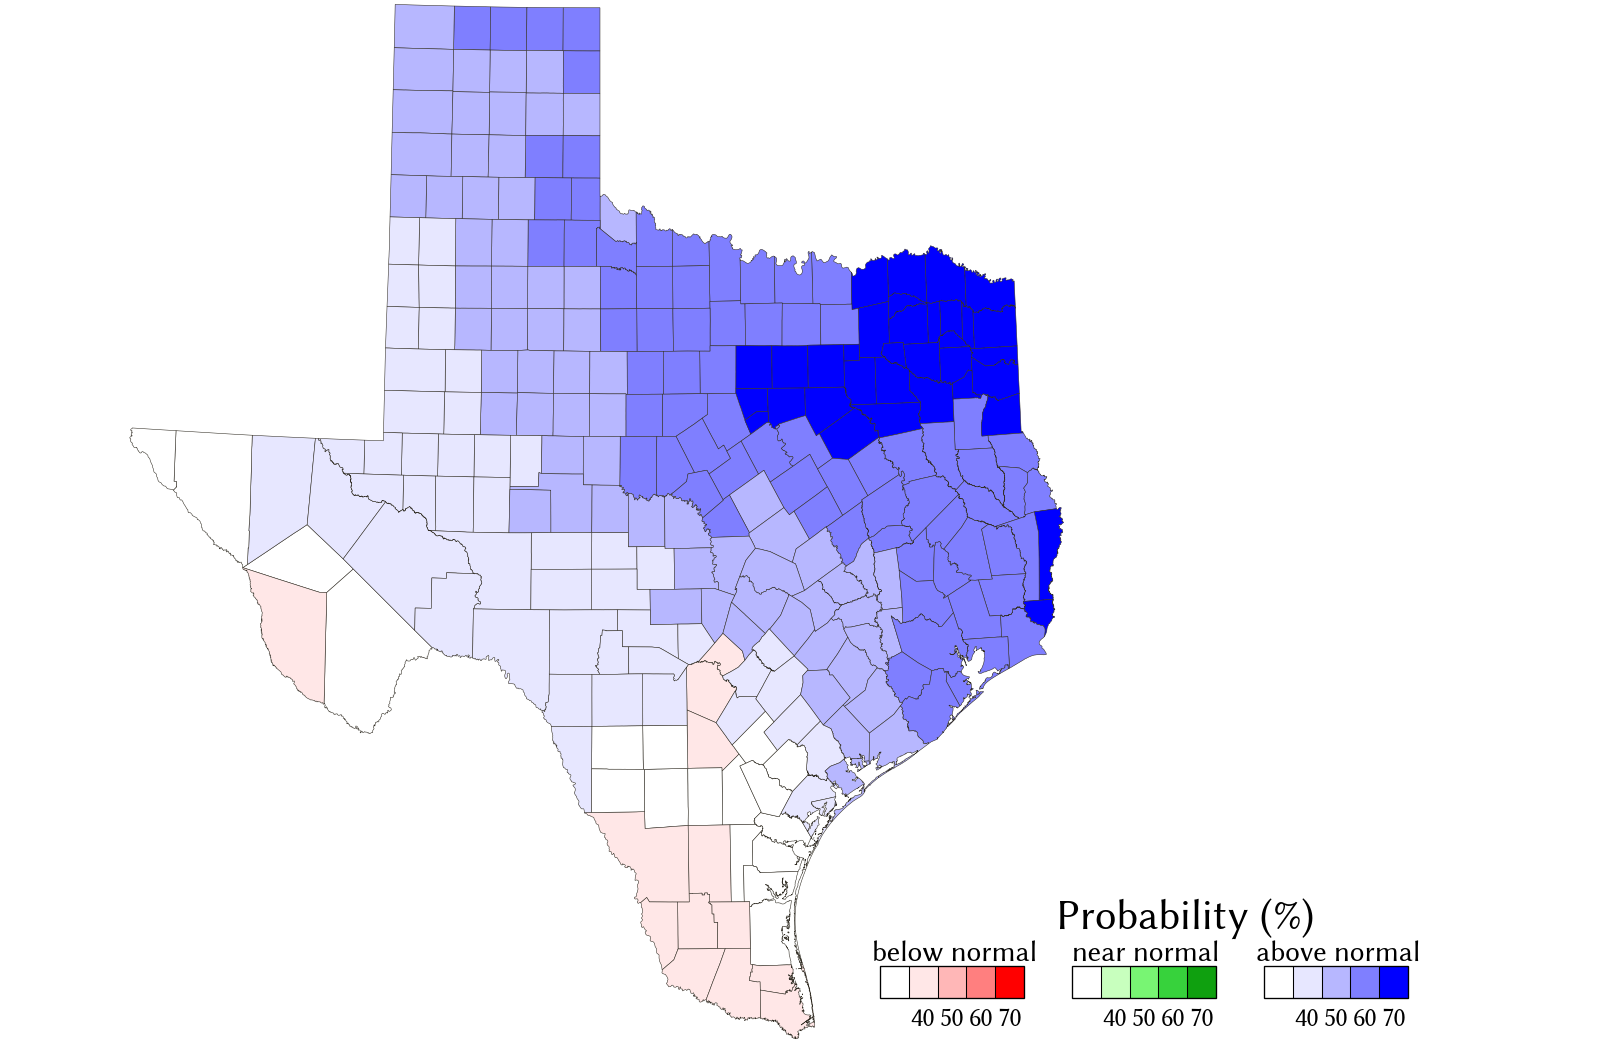
Forecast of Average May–July 2026 Rainfall
Click on county for forecast details
Issued on 2026-05-02
- The Texas Water Development Board issues these May‒July forecasts of seasonal rainfall using a statistical forecast technique (Fernando et al., 2019) based on large scale atmospheric circulation patterns at approximately 5,500 meters above sea level, atmospheric stability influencing the development of convective weather systems, and soil moisture in April known to influence May‒July rainfall.
- The statistical rainfall forecasts are issued from January through end-April. The forecasts are updated every two weeks.
- The forecasts from January through March are based on predicted values of April atmospheric circulation patterns and soil moisture over Texas known to influence May‒July rainfall. The predictions are obtained from the Climate Forecast System version 2 (CFSv2, Saha et al., 2014), which is the operational dynamical seasonal forecast model of the National Oceanic and Atmospheric Administration-National Centers for Environmental Prediction.
- The forecasts issued in April are based on actual observations of April atmospheric circulation patterns and soil moisture over Texas obtained from the Climate Forecast System Reanalysis dataset (Saha et al., 2010).
- The rainfall forecast provides information on whether the average rainfall for the May‒July will be above-normal, near-normal or below normal. Red indicates chances for below-normal (dry) conditions, blue indicates chances for above-normal (wet) conditions, green indicates chances for near-normal (average) conditions, and white indicates that we do not know which way the season might pan out. For more information on how to interpret the forecasts click here.
Disclaimer
The May‒July seasonal rainfall forecast is an experimental forecast. It is primarily meant to be an information source to aid the implementation of drought contingency and emergency management plans. The TWDB provides information via this web site as a public service. Neither the State of Texas nor the TWDB assumes any legal liability or responsibility or makes any guarantees or warranties as to the accuracy, completeness, or suitability of the information for any particular purpose.
Mid-January (6.5-month lead forecast)
End-January (6.0-month lead forecast)
Mid-February (5.5-month lead forecast)
End-February (5.0-month lead forecast)
End-March (4.0-month lead forecast)
End-April (3.0-month lead forecast)