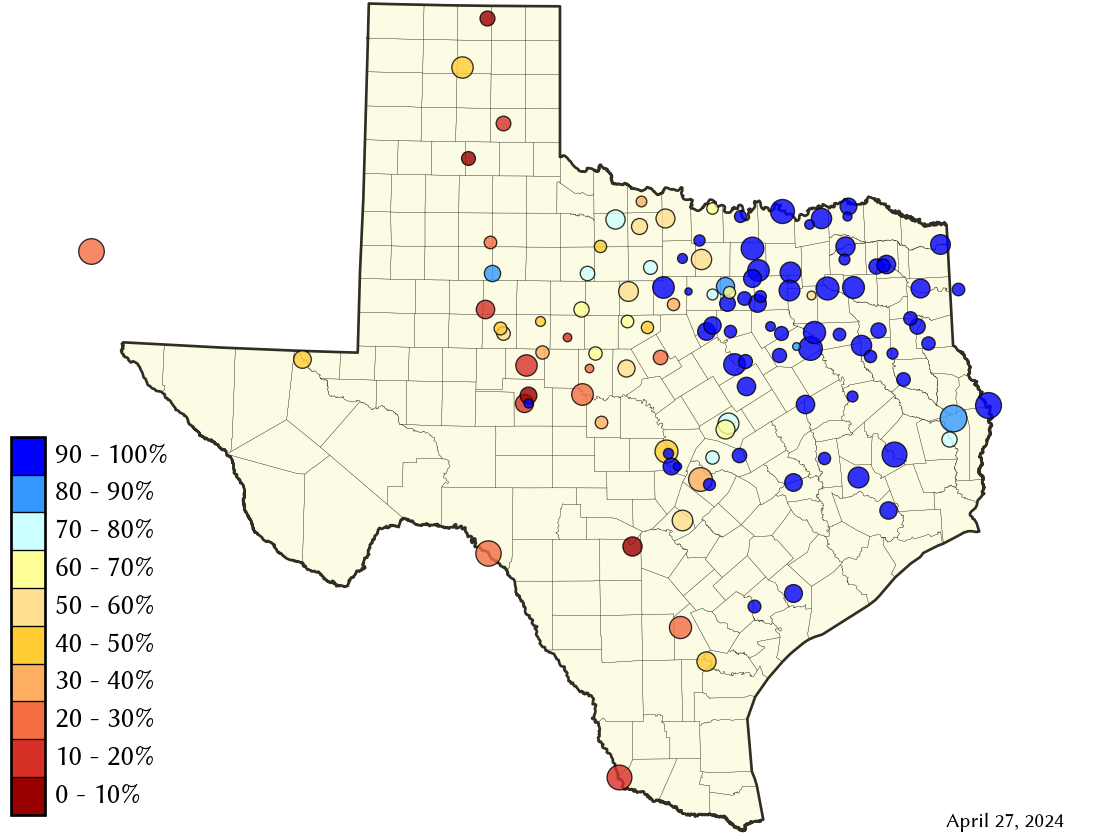
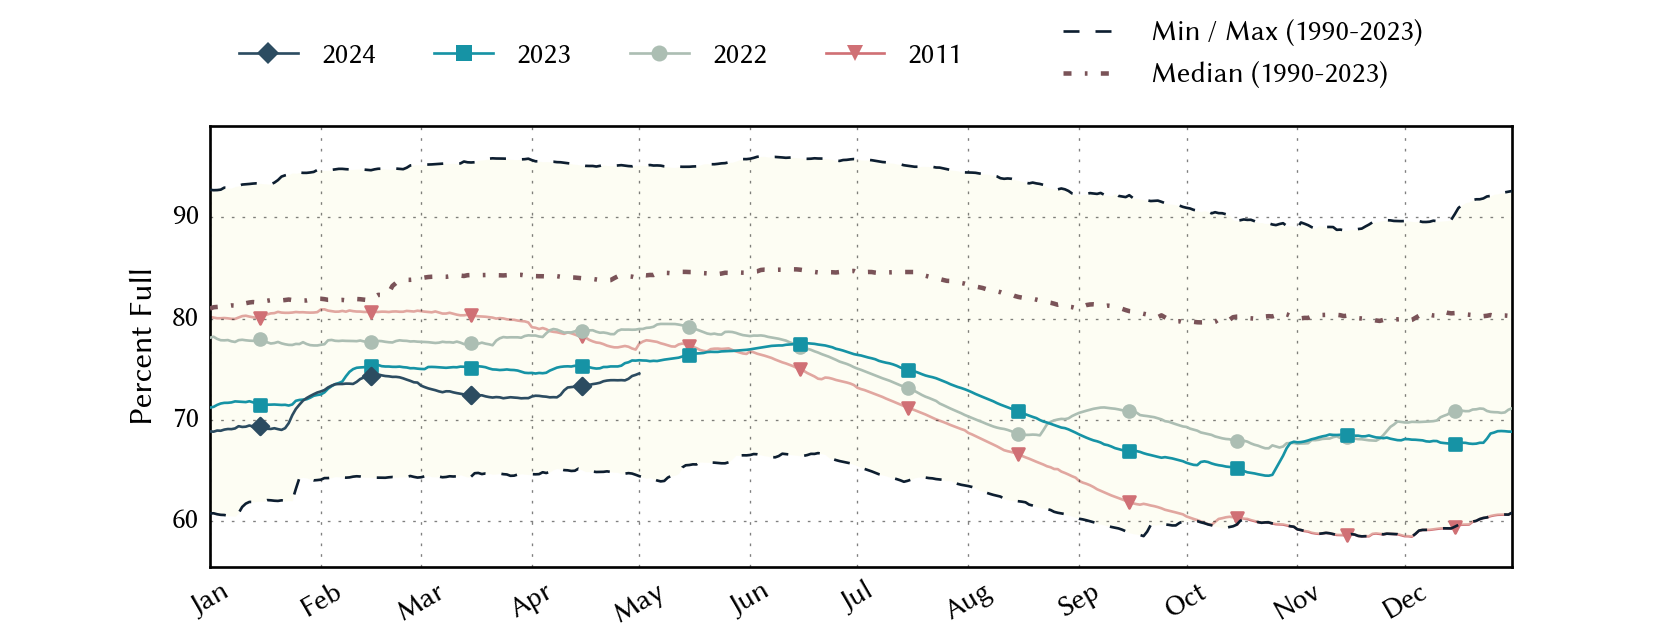
Texas Reservoirs: Monitored Water Supply Reservoirs are 78.0% full on 2026-07-30
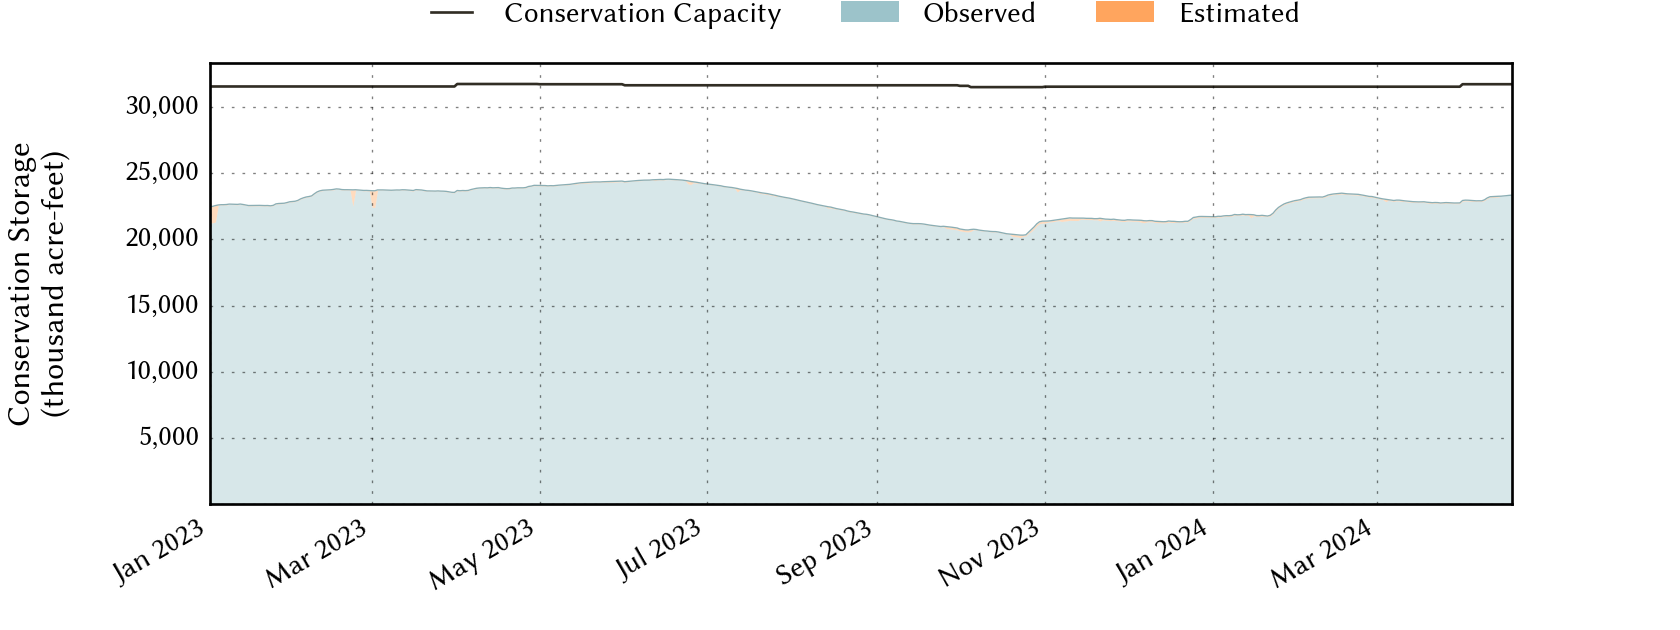
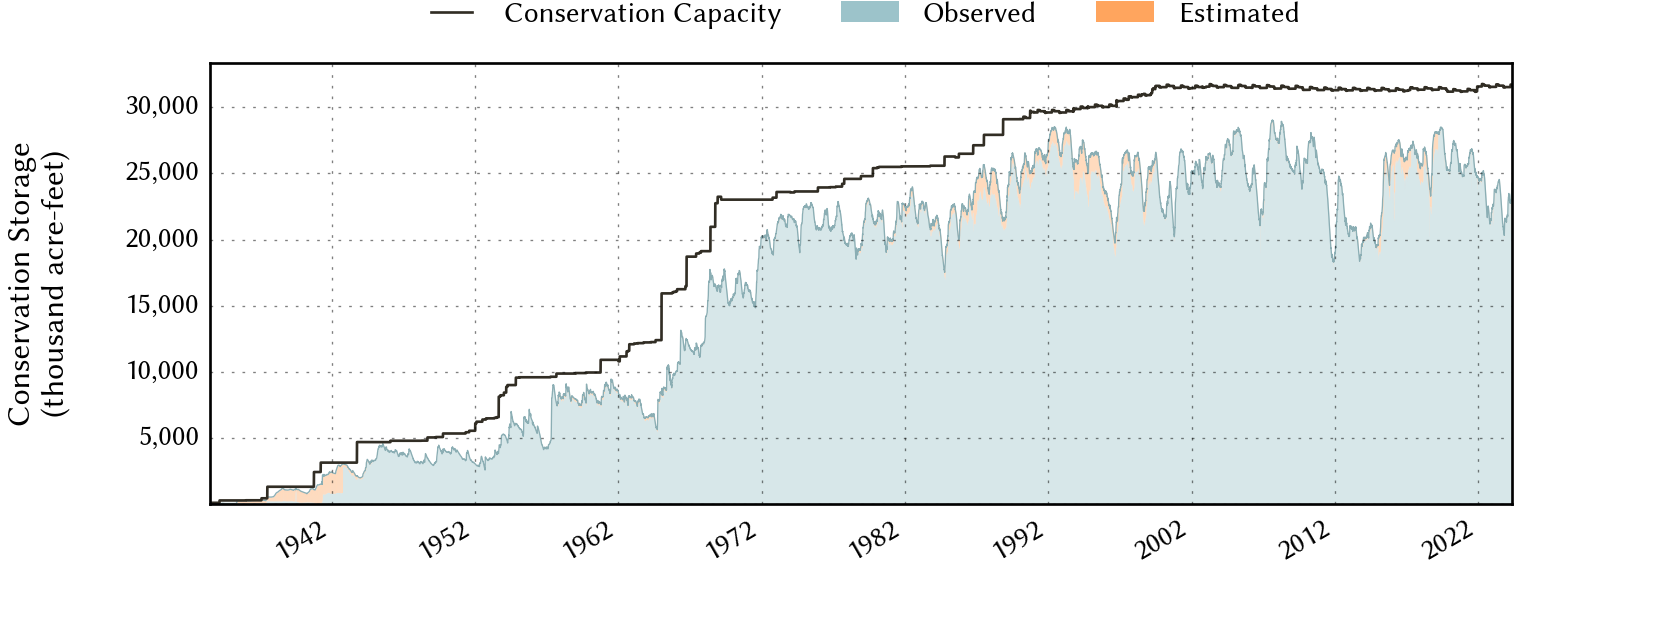
Statewide Conservation Storage
Summary
| Date | Percent Full |
Reservoir Storage (acre-ft) |
Conservation Storage (acre-ft) |
Conservation Capacity (acre-ft) |
|
|---|---|---|---|---|---|
| Today | 2026-07-30 | 78.0 | 28,878,992 | 24,605,699 | 31,558,535 |
| Yesterday | 2026-07-29 | 78.0 | 28,903,602 | 24,615,644 | 31,558,535 |
| 2 days ago | 2026-07-28 | 78.1 | 28,940,192 | 24,639,801 | 31,558,535 |
| 1 week ago | 2026-07-23 | 78.2 | 29,077,883 | 24,685,973 | 31,558,535 |
| 1 month ago | 2026-06-30 | 77.1 | 29,022,202 | 24,336,830 | 31,558,535 |
| 3 months ago | 2026-04-30 | 74.8 | 27,523,788 | 23,571,391 | 31,531,332 |
| 6 months ago | 2026-01-30 | 73.1 | 26,765,414 | 23,046,426 | 31,531,332 |
| 1 year ago | 2025-07-30 | 79.3 | 29,432,477 | 25,036,817 | 31,558,535 |
Percent Full is based on Conservation Storage and Conservation Capacity and doesn't account for storage in flood pool.
Water supply reservoirs include reservoirs which provide water for all beneficial purposes such as power generation, recreation, and municipal water supply. Today's total is subject to change as data are updated. See footnotes on individual lakes for cases where special conditions apply.
Recent Conditions
| Reservoir | Type | Percent Full |
Water Level (ft) |
Height Above Conservation Pool (ft) |
Reservoir Storage (acre-ft) |
Conservation Storage (acre-ft) |
Conservation Capacity (acre-ft) |
Surface Area (acres) |
|---|---|---|---|---|---|---|---|---|
| Abilene |

|
12.9 | 1,994.24 | -18.06 | 1,020 | 1,020 | 7,900 | 175 |
| Addicks 1 |

|
- n.a. - | 76.42 | - n.a. - | - n.a. - | - n.a. - | - n.a. - | - n.a. - |
| Alan Henry |
|
76.2 | 2,210.82 | -9.18 | 73,337 | 73,337 | 96,207 | 2,227 |
| Amistad 2 |

|
38.6 | 1,056.85 | -60.15 | 781,412 | 699,168 | 1,813,408 | 20,911 |
| Amon G Carter |
|
84.2 | 917.83 | -2.17 | 17,012 | 16,228 | 19,266 | 1,327 |
| Aquilla |
|
99.6 | 537.44 | -0.06 | 43,094 | 43,058 | 43,243 | 3,078 |
| Arlington |
|
84.4 | 546.67 | -3.33 | 33,914 | 33,882 | 40,157 | 1,851 |
| Arrowhead |
|
78.6 | 922.37 | -3.63 | 181,101 | 181,101 | 230,359 | 12,634 |
| Athens |
|
98.2 | 439.71 | -0.29 | 29,012 | 28,971 | 29,503 | 1,772 |
| Austin |
|
94.8 | 492.00 | -0.80 | 23,335 | 22,726 | 23,972 | 1,534 |
| B A Steinhagen |
|
96.3 | 82.75 | -0.25 | 66,731 | 66,658 | 69,186 | 10,005 |
| Bardwell |
|
98.2 | 420.76 | -0.24 | 43,131 | 43,070 | 43,856 | 3,261 |
| Barker 3 |
|
- n.a. - | 69.79 | - n.a. - | - n.a. - | - n.a. - | - n.a. - | - n.a. - |
| Belton |
|
100.0 | 594.80 | 0.80 | 442,671 | 432,631 | 432,631 | - n.a. - |
| Benbrook |
|
92.9 | 692.29 | -1.71 | 79,535 | 79,535 | 85,648 | 3,490 |
| Bob Sandlin |
|
94.9 | 336.38 | -1.12 | 193,315 | 182,584 | 192,417 | 8,669 |
| Bois d'Arc |
|
98.4 | 533.64 | -0.36 | 361,823 | 361,823 | 367,609 | 16,370 |
| Bonham |
|
93.3 | 564.29 | -0.71 | 10,303 | 10,291 | 11,027 | 1,019 |
| Brady Creek |
|
92.3 | 1,741.83 | -1.17 | 28,205 | 26,583 | 28,808 | 1,925 |
| Bridgeport |
|
84.0 | 830.91 | -5.09 | 312,645 | 312,645 | 372,183 | 11,150 |
| Brownwood |
|
91.7 | 1,423.27 | -1.33 | 120,049 | 120,049 | 130,868 | 6,458 |
| Buchanan |
|
99.4 | 1,019.77 | -0.23 | 875,199 | 861,537 | 866,694 | 22,398 |
| Caddo 4 |
|
100.0 | 168.64 | 0.14 | 131,538 | 29,898 | 29,898 | 27,045 |
| Canyon |
|
100.0 | 910.06 | 1.06 | 387,648 | 378,781 | 378,781 | - n.a. - |
| Cedar Creek |
|
82.0 | 318.23 | -3.77 | 528,502 | 528,403 | 644,686 | 29,161 |
| Champion Creek |
|
45.0 | 2,063.74 | -19.26 | 18,728 | 18,728 | 41,580 | 889 |
| Cherokee |
|
97.3 | 279.60 | -0.40 | 43,389 | 39,007 | 40,094 | 3,612 |
| Choke Canyon |
|
24.9 | 192.86 | -27.64 | 164,971 | 164,970 | 662,820 | 11,084 |
| Cisco |
|
45.2 | 1,504.38 | -18.08 | 13,120 | 13,120 | 29,003 | 610 |
| Coleman |
|
84.5 | 1,714.15 | -3.35 | 32,207 | 32,189 | 38,075 | 1,696 |
| Coleto Creek |
|
81.1 | 95.53 | -2.47 | 25,173 | 25,173 | 31,040 | 2,304 |
| Colorado City |
|
57.9 | 2,060.13 | -10.07 | 17,801 | 17,801 | 30,758 | - n.a. - |
| Comanche Creek |
|
100.0 | 775.34 | 0.34 | 152,352 | 151,250 | 151,250 | - n.a. - |
| Conroe |
|
99.0 | 200.79 | -0.21 | 413,439 | 413,412 | 417,577 | 19,781 |
| Corpus Christi |
|
33.6 | 83.25 | -10.75 | 86,210 | 85,932 | 256,062 | 11,123 |
| Crook |
|
97.1 | 475.74 | -0.26 | 8,939 | 8,924 | 9,195 | 1,041 |
| Cypress Springs |
|
96.2 | 377.21 | -0.79 | 64,225 | 64,225 | 66,756 | 3,175 |
| E V Spence |
|
10.8 | 1,844.30 | -53.70 | 55,644 | 55,644 | 517,272 | 3,549 |
| Eagle Mountain |
|
84.8 | 645.87 | -3.23 | 156,874 | 156,874 | 185,087 | 8,284 |
| Elephant Butte 5 |
|
1.4 | 4,275.13 | -130.46 | 26,732 | 26,732 | 1,960,900 | 2,266 |
| Falcon 2 |
|
26.9 | 264.99 | -36.21 | 573,405 | 420,854 | 1,562,367 | 32,282 |
| Fork |
|
88.1 | 400.18 | -2.82 | 565,316 | 533,873 | 606,088 | 24,327 |
| Fort Phantom Hill |
|
75.1 | 1,630.98 | -4.92 | 52,623 | 52,617 | 70,030 | 3,178 |
| Georgetown |
|
100.0 | 791.60 | 0.60 | 38,858 | 38,005 | 38,005 | - n.a. - |
| Gibbons Creek |
|
96.4 | 246.63 | -0.37 | 26,488 | 24,784 | 25,721 | 2,513 |
| Graham |
|
73.4 | 1,069.74 | -5.26 | 33,276 | 33,262 | 45,288 | 2,064 |
| Granbury |
|
93.3 | 691.58 | -1.12 | 124,934 | 124,025 | 132,949 | 7,764 |
| Granger |
|
100.0 | 505.49 | 1.49 | 58,183 | 51,822 | 51,822 | - n.a. - |
| Grapevine |
|
99.7 | 534.92 | -0.08 | 162,537 | 162,537 | 163,064 | 6,601 |
| Greenbelt |
|
5.7 | 2,609.13 | -54.87 | 3,840 | 3,408 | 59,968 | 308 |
| Halbert |
|
81.7 | 366.01 | -1.99 | 4,929 | 4,929 | 6,033 | 532 |
| Hords Creek |
|
51.0 | 1,889.93 | -10.07 | 4,136 | 4,133 | 8,109 | 296 |
| Houston |
|
97.5 | 42.09 | -0.29 | 132,820 | 129,019 | 132,318 | 11,314 |
| Houston County |
|
98.9 | 259.86 | -0.14 | 17,485 | 16,933 | 17,113 | 1,286 |
| Hubbard Creek |
|
40.7 | 1,167.86 | -15.45 | 132,373 | 127,497 | 313,298 | 8,634 |
| Hubert H Moss |
|
96.2 | 714.15 | -0.85 | 23,245 | 23,148 | 24,058 | 1,059 |
| Inks |
|
95.1 | 887.15 | -0.85 | 13,335 | 13,052 | 13,729 | 789 |
| J B Thomas |
|
23.8 | 2,228.46 | -29.54 | 48,338 | 47,665 | 199,931 | 3,320 |
| Jacksonville |
|
99.1 | 421.79 | -0.21 | 25,489 | 25,427 | 25,670 | 1,154 |
| Jim Chapman |
|
84.8 | 437.73 | -2.27 | 255,124 | 219,349 | 258,723 | 16,692 |
| Joe Pool |
|
98.2 | 521.59 | -0.41 | 148,279 | 146,909 | 149,629 | 6,586 |
| Kemp |
|
82.8 | 1,141.68 | -2.32 | 203,278 | 203,152 | 245,307 | 11,423 |
| Kickapoo |
|
86.2 | 1,042.88 | -2.12 | 74,424 | 74,424 | 86,345 | 5,382 |
| Lake O' the Pines |
|
93.3 | 229.01 | -0.99 | 250,443 | 250,443 | 268,566 | - n.a. - |
| Lavon |
|
96.5 | 491.29 | -0.71 | 398,070 | 395,229 | 409,757 | 20,315 |
| Leon |
|
84.6 | 1,372.42 | -2.58 | 23,774 | 23,494 | 27,762 | 1,553 |
| Lewisville |
|
97.7 | 521.51 | -0.49 | 585,750 | 550,076 | 563,228 | 26,661 |
| Limestone |
|
95.8 | 362.31 | -0.69 | 195,302 | 195,302 | 203,780 | 12,168 |
| Livingston |
|
99.2 | 130.84 | -0.16 | 1,591,117 | 1,591,117 | 1,603,504 | 77,119 |
| Lost Creek |
|
92.6 | 1,007.25 | -2.25 | 11,070 | 11,070 | 11,950 | - n.a. - |
| Lyndon B Johnson |
|
97.5 | 824.56 | -0.44 | 128,797 | 109,957 | 112,778 | 6,391 |
| Mackenzie |
|
11.6 | 3,019.88 | -80.12 | 5,370 | 5,370 | 46,450 | 244 |
| Marble Falls |
|
95.0 | 736.37 | -0.63 | 7,215 | 7,215 | 7,597 | 601 |
| Martin |
|
92.5 | 304.83 | -1.17 | 70,054 | 70,054 | 75,726 | 4,741 |
| Medina |
|
29.4 | 1,021.37 | -42.83 | 74,829 | 74,829 | 254,823 | 2,502 |
| Meredith 6 |
|
43.0 | 2,890.44 | -46.06 | 253,443 | 215,029 | 500,000 | 8,566 |
| Millers Creek |
|
66.3 | 1,329.20 | -4.80 | 19,039 | 17,756 | 26,768 | 1,531 |
| Mineral Wells |
|
96.6 | 862.61 | -0.39 | 5,093 | 5,093 | 5,273 | 457 |
| Monticello |
|
79.6 | 336.22 | -3.78 | 27,668 | 27,668 | 34,740 | 1,659 |
| Mountain Creek |
|
100.0 | 457.48 | 0.48 | 24,052 | 22,850 | 22,850 | 2,815 |
| Murvaul |
|
96.9 | 264.95 | -0.35 | 37,091 | 37,091 | 38,285 | 3,391 |
| Nacogdoches |
|
93.1 | 277.72 | -1.28 | 36,804 | 36,802 | 39,522 | 2,066 |
| Nasworthy |
|
85.6 | 1,871.73 | -0.98 | 8,726 | 8,233 | 9,615 | 1,234 |
| Navarro Mills |
|
92.9 | 423.74 | -0.76 | 46,309 | 46,308 | 49,827 | 4,556 |
| New Terrell City |
|
29.8 | 494.66 | -9.34 | 2,565 | 2,554 | 8,583 | 402 |
| Nocona |
|
79.8 | 824.12 | -3.38 | 17,424 | 17,120 | 21,444 | 1,215 |
| North Fork Buffalo Creek |
|
85.6 | 1,046.61 | -1.39 | 13,190 | 13,190 | 15,400 | 1,363 |
| O C Fisher |
|
12.6 | 1,874.01 | -33.99 | 14,570 | 14,569 | 115,742 | 1,228 |
| O H Ivie |
|
46.2 | 1,531.78 | -19.72 | 256,328 | 256,328 | 554,340 | - n.a. - |
| Oak Creek |
|
16.3 | 1,975.25 | -24.75 | 6,550 | 6,400 | 39,210 | 588 |
| Palestine |
|
96.6 | 344.45 | -0.55 | 354,737 | 354,728 | 367,303 | 22,620 |
| Palo Duro |
|
0.4 | 2,826.22 | -65.78 | 224 | 224 | 61,066 | - n.a. - |
| Palo Pinto |
|
92.2 | 866.03 | -0.97 | 25,061 | 24,675 | 26,766 | 2,136 |
| Pat Cleburne |
|
94.5 | 732.58 | -0.92 | 24,581 | 24,581 | 26,008 | 1,537 |
| Pat Mayse |
|
100.0 | 451.20 | 0.20 | 118,973 | 113,683 | 113,683 | - n.a. - |
| Possum Kingdom |
|
93.7 | 997.06 | -1.94 | 504,248 | 504,248 | 538,139 | 17,019 |
| Proctor |
|
79.3 | 1,159.43 | -2.57 | 43,442 | 43,442 | 54,762 | 4,152 |
| Ray Hubbard |
|
96.4 | 434.73 | -0.77 | 423,730 | 423,730 | 439,559 | 20,291 |
| Ray Roberts |
|
99.4 | 632.34 | -0.16 | 783,960 | 783,637 | 788,167 | 28,261 |
| Red Bluff |
|
48.2 | 2,815.54 | -12.56 | 70,007 | 70,007 | 145,165 | 4,688 |
| Richland-Chambers |
|
95.8 | 313.94 | -1.06 | 1,079,143 | 1,053,360 | 1,099,417 | 43,027 |
| Sam Rayburn |
|
72.0 | 156.61 | -7.79 | 2,077,206 | 2,058,250 | 2,857,077 | 90,757 |
| Somerville |
|
100.0 | 239.25 | 1.25 | 164,751 | 150,293 | 150,293 | - n.a. - |
| Stamford |
|
74.5 | 1,414.19 | -2.61 | 38,426 | 38,423 | 51,570 | 4,128 |
| Stillhouse Hollow |
|
100.0 | 622.70 | 0.70 | 234,417 | 229,796 | 229,796 | - n.a. - |
| Striker |
|
92.1 | 292.31 | -0.69 | 20,468 | 15,546 | 16,878 | 1,905 |
| Sulphur Springs |
|
99.4 | 458.89 | -0.06 | 17,637 | 17,637 | 17,747 | - n.a. - |
| Sweetwater |
|
19.5 | 2,092.17 | -24.33 | 2,395 | 2,395 | 12,267 | 223 |
| Tawakoni |
|
98.5 | 437.14 | -0.36 | 858,449 | 858,441 | 871,685 | 36,576 |
| Texana |
|
98.0 | 43.69 | -0.31 | 161,024 | 155,811 | 158,975 | 10,140 |
| Texoma 7 |
|
100.0 | 618.19 | 1.19 | 2,579,611 | 1,243,801 | 1,243,801 | 79,326 |
| Toledo Bend 8 |
|
92.4 | 169.92 | -2.08 | 4,138,254 | 2,067,077 | 2,236,450 | 172,450 |
| Travis |
|
100.0 | 681.10 | 0.10 | 1,116,982 | 1,098,044 | 1,098,044 | 19,068 |
| Twin Buttes |
|
7.7 | 1,899.62 | -40.58 | 17,832 | 14,083 | 182,454 | 1,332 |
| Tyler |
|
96.8 | 374.88 | -0.50 | 74,955 | 69,744 | 72,073 | 4,601 |
| Waco |
|
97.6 | 461.67 | -0.55 | 184,502 | 184,276 | 188,891 | 8,342 |
| Waxahachie |
|
94.0 | 530.47 | -1.03 | 10,975 | 10,393 | 11,060 | 640 |
| Weatherford |
|
62.7 | 889.24 | -6.76 | 11,177 | 11,177 | 17,812 | 894 |
| White River |
|
24.6 | 2,350.64 | -21.56 | 7,843 | 7,843 | 31,846 | 707 |
| Whitney |
|
99.5 | 532.87 | -0.13 | 563,152 | 561,798 | 564,808 | 23,100 |
| Worth |
|
76.8 | 592.30 | -1.70 | 27,840 | 18,764 | 24,419 | 3,224 |
| Wright Patman |
|
100.0 | 226.95 | 6.35 | 292,028 | 122,593 | 122,593 | - n.a. - |
Addicks Reservoir is a flood control lake. It is not used for water supply and under normal conditions it is empty.
Lake Amistad and Lake Falcon straddle the border of Texas and Mexico. By treaty, Texas has rights to 56.2% of the total conservation capacity of Amistad and 58.6% of the total conservation capacity of Falcon. The fraction of the actual storage that belongs to Texas is formally determined biweekly by the International Boundary Water Commission (IBWC). The IBWC is the legal repository of data related to this lake for treaty purposes and official versions of the datasets should be obtained directly from them. Conservation capacity is based on the fixed percent of total conservation capacity. Conservation storage is based on the bi-weekly changing Texas share.
Barker Reservoir is a flood control lake. It is not used for water supply and under normal conditions it is empty.
Caddo Lake straddles the border of Texas and Louisiana, Texas has rights to 50% of Lake Caddo's total conservation capacity. Percent full, conservation storage and conservation capacity are based on the Texas share.
Elephant Butte Lake (located in New Mexico) is governed by the Rio Grande Compact. The Rio Grande Compact is an interstate compact signed in 1938 between the states of Colorado, New Mexico and Texas and approved by the U.S. Congress, to equitably apportion the waters of the Rio Grande Basin. Water from the lake supplies irrigation water as well as a portion of El Paso's supply when available.
Lake Meredith is governed by the Canadian River Compact. The States of New Mexico, Texas and Oklahoma are all parties to the compact created by agreement of the three states and the federal government in 1950. According to the compact, New Mexico can hold 200,000 acre-feet in Ute Lake before it has to release water to Texas. Texas also can only hold 500,000 acre-feet in Lake Meredith before it has to release water for Oklahoma.
Lake Texoma straddles the border of Texas and Oklahoma, Texas has rights to 50% of Lake Texoma's total conservation capacity. Percent full, conservation storage and conservation capacity are based on the Texas share.
Toledo Bend Reservoir straddles the border of Texas and Louisiana, Texas has rights to 50% of Toledo Bend Reservoir's total conservation capacity. Percent full, conservation storage and conservation capacity are based on the Texas share.