Information on Precipitation and Gross Lake Evaporation Data
Evaporation is a major component of water loss from Texas reservoirs and is an important factor that needs to be accounted for in reservoir operations and in developing water availability models (WAM) for river basins in Texas. The WAMs are used for regional water planning in the state. The Texas Water Development Board has been compiling and providing precipitation and reservoir evaporation data since 1997 to make available the data needed for developing the WAM models, and to fulfil precipitation and lake evaporation data requests from the general public.
Data are provided at monthly and annual time steps in one-degree quadrangles (i.e., 1° x 1° spatial resolution) that cover the state of Texas. The quadrangular precipitation and lake evaporation rates are based on daily precipitation and daily pan evaporation measured at monitoring stations in Texas, Louisiana, Arkansas, Oklahoma, and New Mexico.
The source of daily precipitation data is the National Oceanic and Atmospheric Administration (NOAA)-National Weather Service’s (NWS’s) precipitation gauge network. Class A pan evaporation data are obtained from NOAA-NWS monitoring stations and from TWDB cooperators (known as “TWDB COOP stations”) such as lake owners or operators, government agencies, research institutes, and other public or private entities who collect evaporation data. The NOAA-NWS data are accessed through the National Centers for Environmental Information (NCEI).
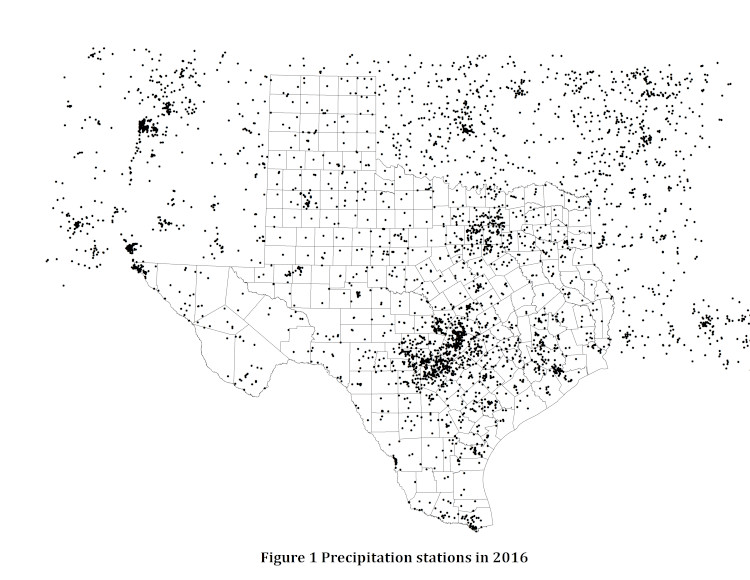
The number of reporting precipitation gauges has increased steadily over the past two decades and there is a good spatial coverage within Texas. There are approximately 3,959 precipitation gauging stations in Texas and surrounding states in 2016 (figure 1).

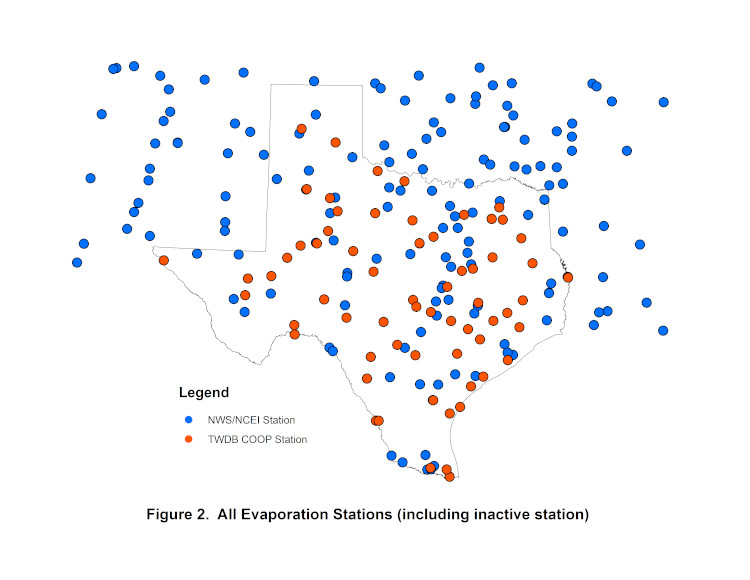
Figure 2 shows all pan evaporations that we have used in the compilation of the evaporation dataset over the years.

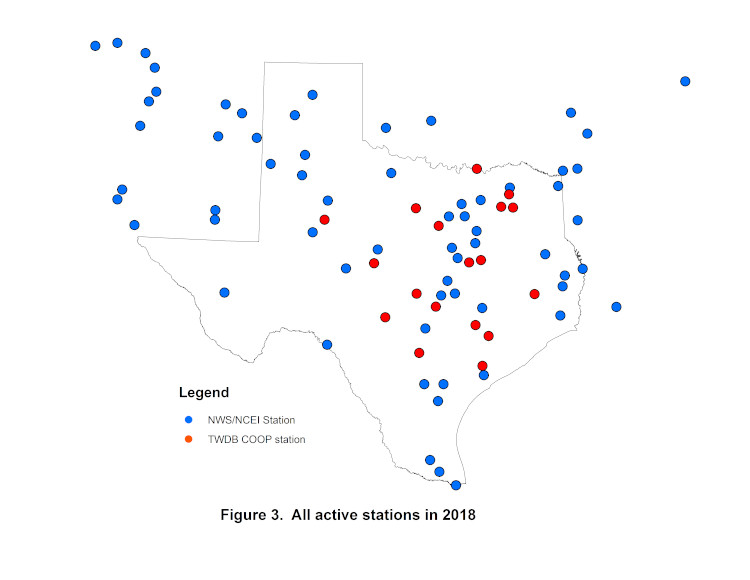
However, the number of evaporation stations reporting data varies from year to year and each station may not necessarily report every month in a given year. For example, figure 3 shows all active stations for 2018

Table 1 provides the number of reporting pan evaporation stations from 1999 through 2025.
Year |
1999 |
2000 |
2001 |
2002 |
2003 |
2004 |
2005 |
2006 |
2007 |
2008 |
2009 |
2010 |
|
Total number of stations |
95 |
99 |
95 |
101 |
100 |
102 |
93 |
97 |
85 |
92 |
93 |
89 |
|
Number of TWDB COOP stations |
30 |
30 |
23 |
32 |
27 |
28 |
25 |
25 |
16 |
20 |
18 |
21 |
|
(continue) |
|||||||||||||
Year |
2011 |
2012 |
2013 |
2014 |
2015 |
2016 |
2017 |
2018 |
2019 |
2020 |
2021 |
2022 |
2023 |
Total number of stations |
82 |
84 |
83 |
80 |
80 |
78 |
86 |
82 |
84 |
80 |
86 |
87 |
77 |
Number of TWDB COOP stations |
18 |
19 |
18 |
16 |
16 |
16 |
16 |
18 |
18 |
18 |
17 |
17 |
17 |
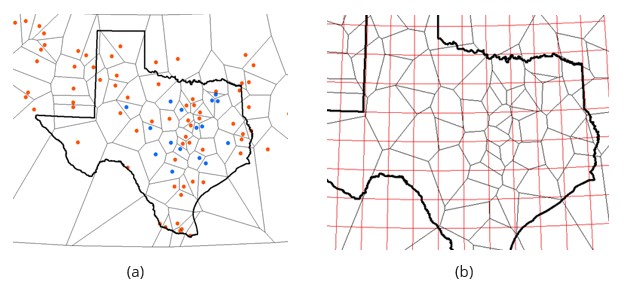
Monthly quadrangular lake evaporation rates are produced in four steps. First the daily gross pan evaporation rates measured at all evaporation stations are summed into monthly pan evaporation rates, after a strict quality assurance and quality control (QA/QC) procedure. Second, a Thiessen polygon network covering Texas and its surrounding states is developed based on the location of the available evaporation stations for each month. Each evaporation station's effective region is the area within its polygon(Figure 4(a)). Third, the quadrangular pan evaporation rate is calculated as the sum of the pan evaporation rates of all stations weighted by the areas of their polygons in the quadrangle(Figure 4(b)).

Thiessen Polygon layer (a) and then being intersected by 1*1-degree quadrangular grids (b)
Fourth, the quadrangular pan evaporation rates are converted into quadrangular lake evaporation rates by multiplying the pan evaporation rates with the monthly pan-to-lake coefficients (the new pan-to-lake coefficients table). This table was developed by Texas Department of Water Resources staff in the 1980s, based on information published by the National Weather Service ( NOAA Technical Report NWS 33) in 1982. The quadrangular precipitation is produced using steps 1 to 3 mentioned above. The annual quadrangular precipitation is the sum of the monthly quadrangular precipitation.
Although the precipitation and evaporation data from stations located in surrounding states are used in this application, we do not publish processed data for other states.
If you have any questions, please contact customer service.