Reservoir Storage Summary for Climate Divisions on 2024-04-28
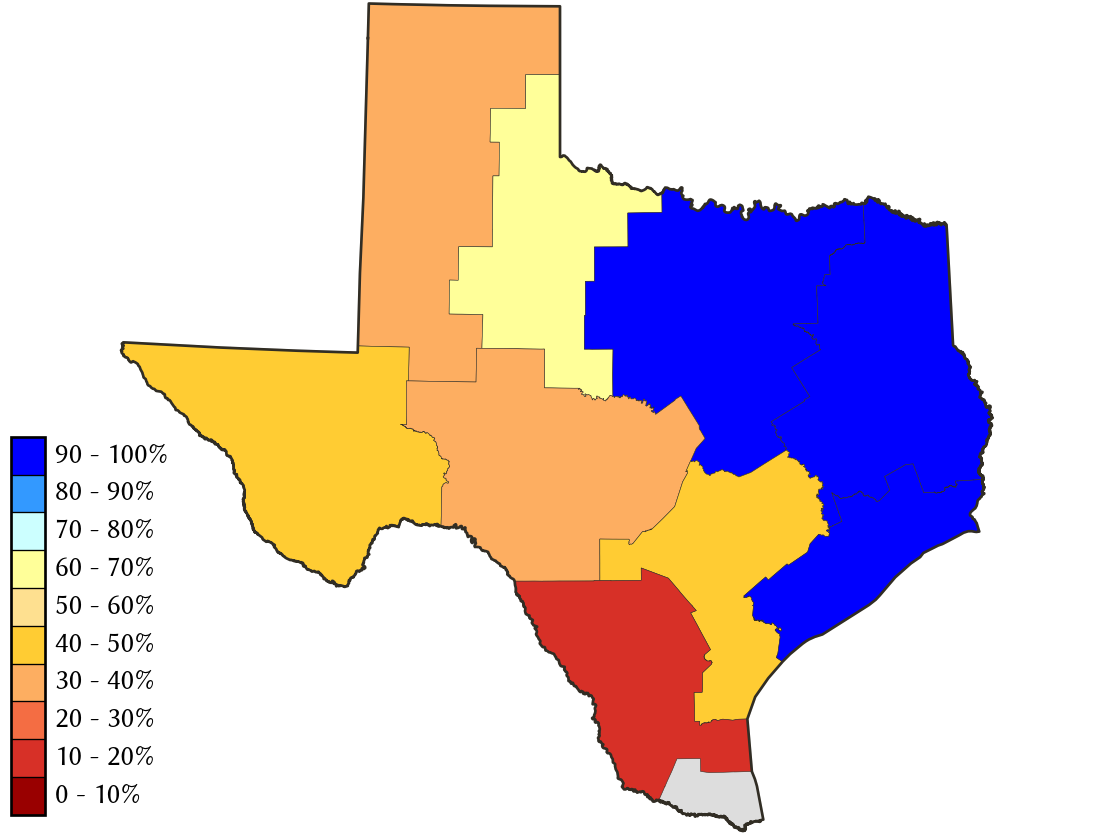
Percent Full
| Today | Yesterday | 2 days ago | 1 week ago | 1 month ago | 3 months ago | 6 months ago | 1 year ago | |
|---|---|---|---|---|---|---|---|---|
| 2024-04-28 | 2024-04-27 | 2024-04-26 | 2024-04-21 | 2024-03-28 | 2024-01-28 | 2023-10-28 | 2023-04-28 | |
| East Texas | 96.3 | 96.3 | 96.4 | 96.0 | 91.5 | 93.2 | 83.8 | 99.2 |
| Edwards Plateau | 31.2 | 31.1 | 31.1 | 31.2 | 31.3 | 30.1 | 32.5 | 38.1 |
| High Plains | 36.4 | 36.4 | 36.4 | 36.5 | 36.9 | 37.1 | 37.4 | 24.3 |
| Low Rolling Plains | 54.7 | 53.5 | 53.4 | 53.3 | 53.3 | 52.4 | 51.8 | 50.6 |
| North Central | 92.0 | 91.7 | 91.7 | 91.6 | 90.4 | 89.1 | 81.8 | 88.1 |
| South | 17.7 | 17.8 | 18.0 | 18.5 | 21.0 | 22.3 | 18.6 | 29.9 |
| South Central | 43.4 | 43.4 | 43.4 | 43.6 | 44.1 | 43.9 | 41.5 | 51.0 |
| Trans Pecos | 41.3 | 41.4 | 41.4 | 41.3 | 41.4 | 41.4 | 39.4 | 58.0 |
| Upper Coast | 97.7 | 97.7 | 97.8 | 95.4 | 99.8 | 99.9 | 85.7 | 99.9 |
*
Percent Full is based on Conservation Storage and Conservation Capacity.
Recent Conditions
| Percent Full |
Reservoir Storage (acre-ft) |
Conservation Storage (acre-ft) |
Conservation Capacity (acre-ft) |
|
|---|---|---|---|---|
| East Texas | 96.3 | 12,446,103 | 9,697,113 | 10,074,732 |
| Edwards Plateau | 31.2 | 1,523,128 | 1,327,580 | 4,261,647 |
| High Plains | 36.4 | 272,173 | 231,793 | 637,396 |
| Low Rolling Plains | 54.7 | 496,677 | 494,133 | 903,870 |
| North Central | 92.0 | 11,785,446 | 10,107,833 | 10,984,350 |
| South | 17.7 | 725,750 | 438,620 | 2,481,249 |
| South Central | 43.4 | 873,769 | 839,933 | 1,936,953 |
| Trans Pecos | 41.3 | 62,409 | 62,409 | 151,110 |
| Upper Coast | 97.7 | 295,469 | 284,503 | 291,293 |
**
The Lower Valley climate division has no contributing Reservoirs present.