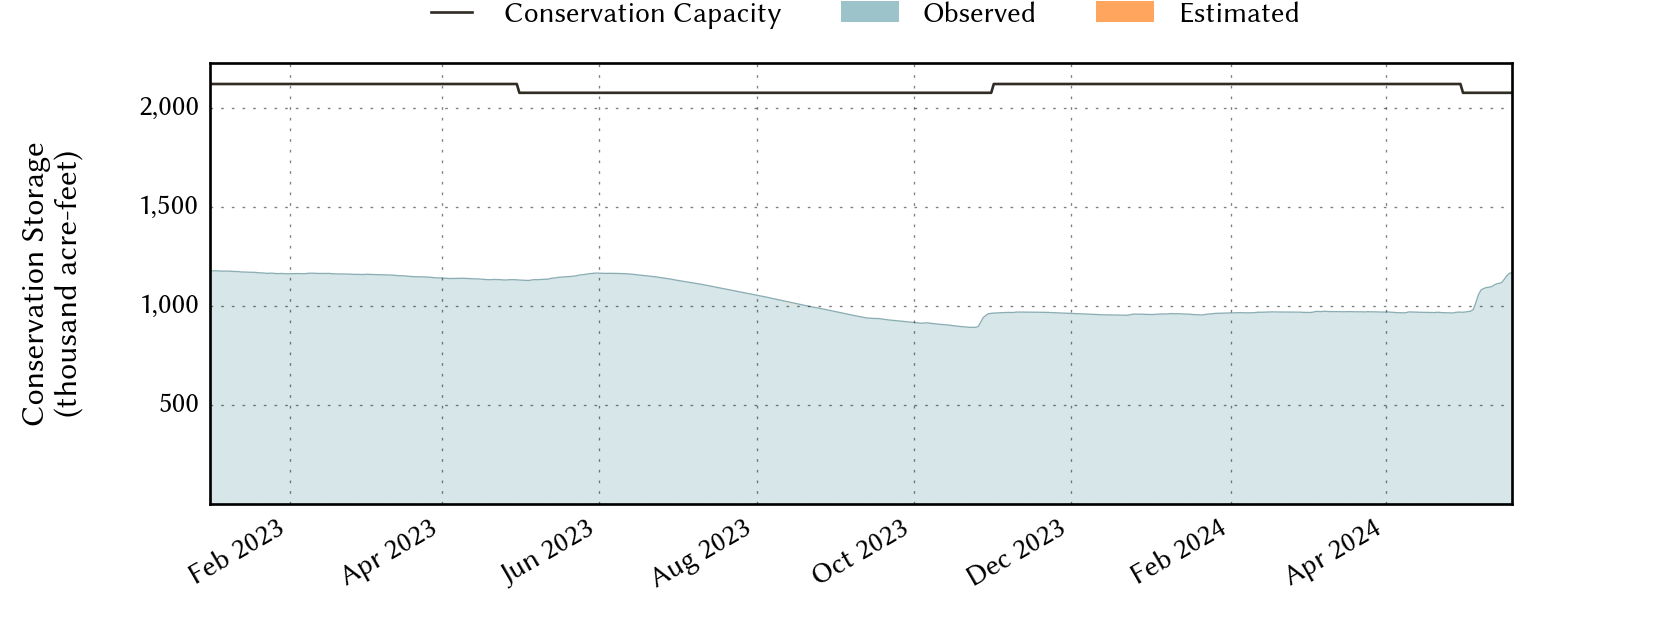
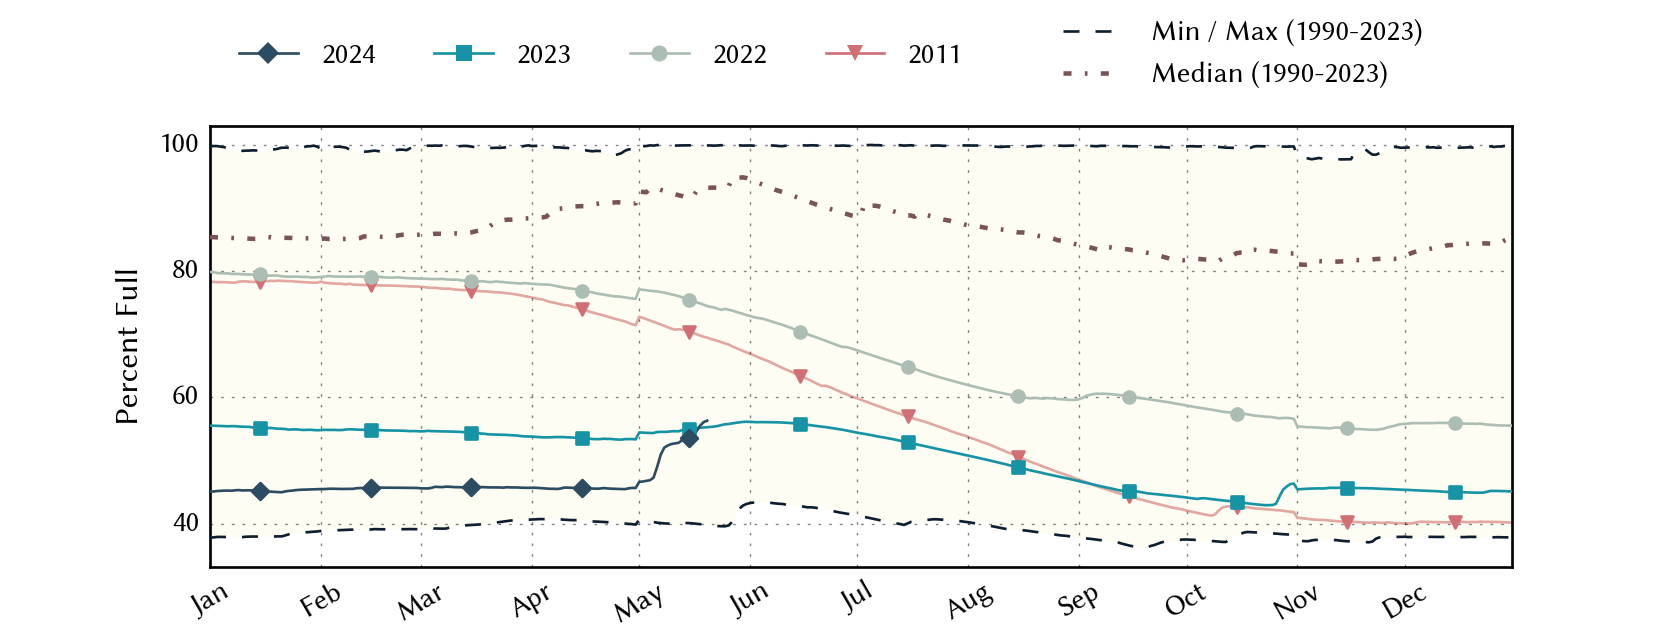
Lower-Colorado Planning Region Reservoirs: Monitored Water Supply Reservoirs are 45.6% full on 2024-04-28
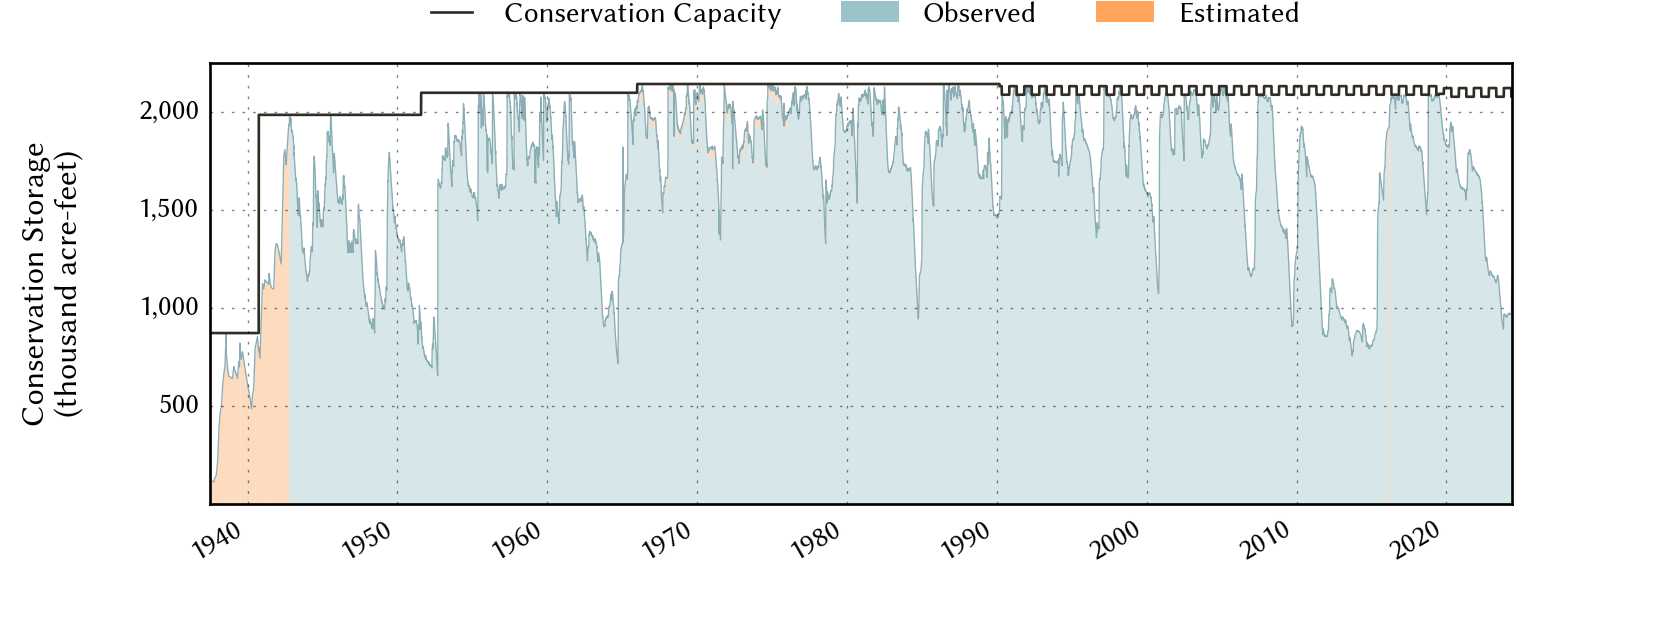
Historical Data
| Date | Percent Full |
Reservoir Storage (acre-ft) |
Conservation Storage (acre-ft) |
Conservation Capacity (acre-ft) |
|
|---|---|---|---|---|---|
| Today | 2024-04-28 | 45.6 | 1,017,582 | 967,156 | 2,122,814 |
| Yesterday | 2024-04-27 | 45.5 | 1,015,968 | 965,542 | 2,122,814 |
| 2 days ago | 2024-04-26 | 45.5 | 1,016,342 | 965,916 | 2,122,814 |
| 1 week ago | 2024-04-21 | 45.7 | 1,019,537 | 969,111 | 2,122,814 |
| 1 month ago | 2024-03-28 | 45.7 | 1,021,588 | 971,162 | 2,122,814 |
| 3 months ago | 2024-01-28 | 45.4 | 1,014,632 | 964,206 | 2,122,814 |
| 6 months ago | 2023-10-28 | 45.4 | 994,049 | 943,623 | 2,078,327 |
| 1 year ago | 2023-04-28 | 53.4 | 1,183,945 | 1,133,519 | 2,122,814 |
*
Percent Full is based on Conservation Storage and Conservation Capacity and doesn't account for storage in flood pool.
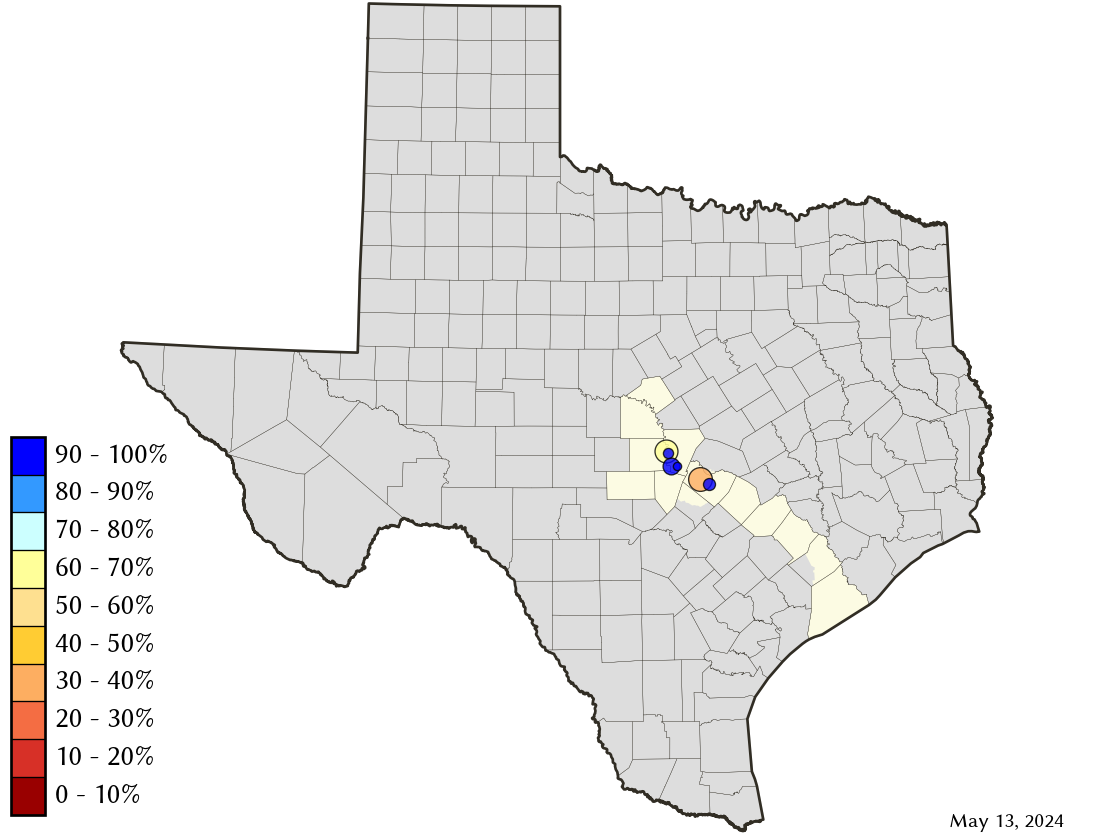
Area Map
Reservoir Storage
| Reservoir | Percent Full |
Water Level (ft) |
Height Above Conservation Pool (ft) |
Reservoir Storage (acre-ft) |
Conservation Storage (acre-ft) |
Conservation Capacity (acre-ft) |
Surface Area (acres) |
|---|---|---|---|---|---|---|---|
| Austin | 95.6 | 492.13 | -0.67 | 23,535 | 22,926 | 23,972 | 1,541 |
| Buchanan | 46.9 | 995.30 | -24.70 | 419,776 | 406,114 | 866,694 | 14,304 |
| Inks | 94.2 | 886.99 | -1.01 | 13,211 | 12,928 | 13,729 | 775 |
| Lyndon B Johnson | 98.5 | 824.74 | -0.26 | 129,949 | 111,109 | 112,778 | 6,407 |
| Marble Falls | 95.1 | 736.38 | -0.62 | 7,221 | 7,221 | 7,597 | 601 |
| Travis | 37.1 | 630.26 | -50.74 | 423,890 | 406,858 | 1,098,044 | 9,214 |