Low-Rolling-Plains Climate Division Reservoirs: Monitored Water Supply Reservoirs are 54.6% full on 2024-04-28
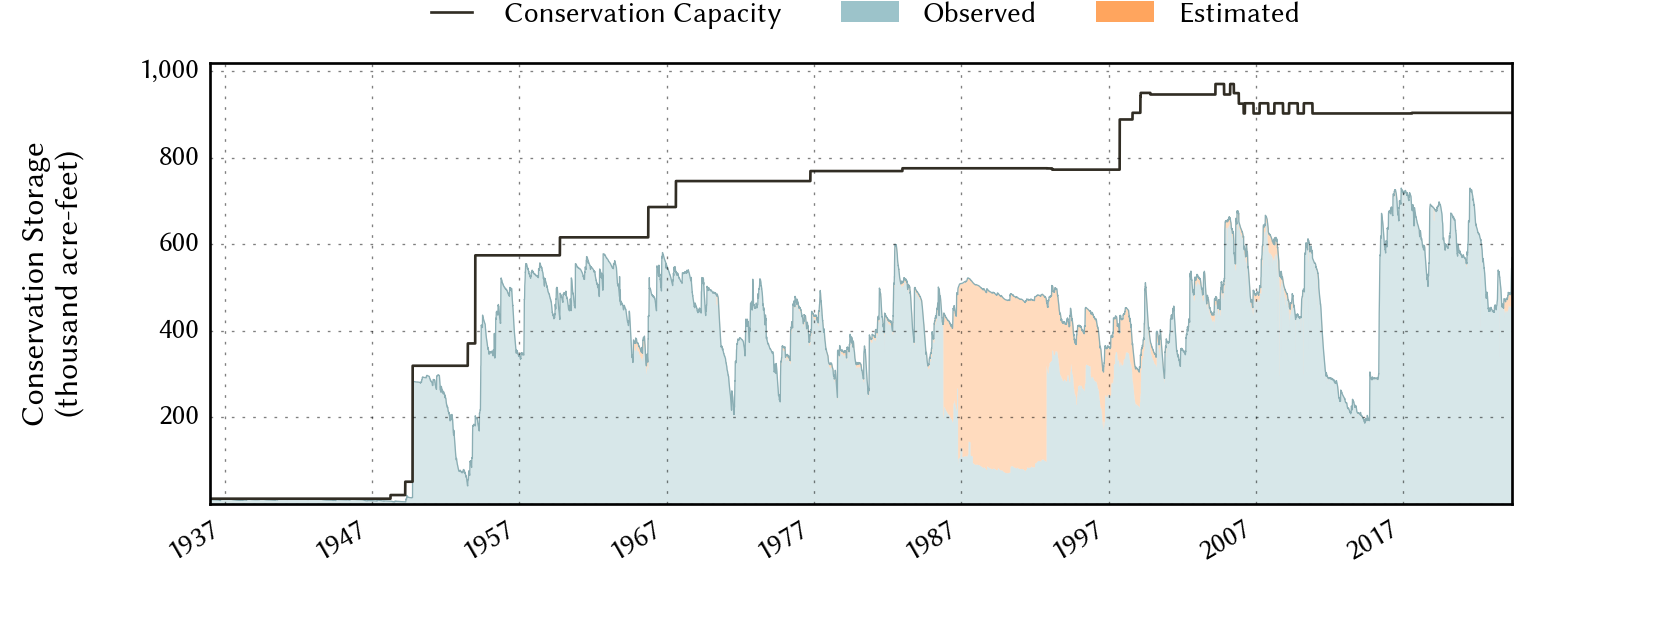
Historical Data
| Date | Percent Full |
Reservoir Storage (acre-ft) |
Conservation Storage (acre-ft) |
Conservation Capacity (acre-ft) |
|
|---|---|---|---|---|---|
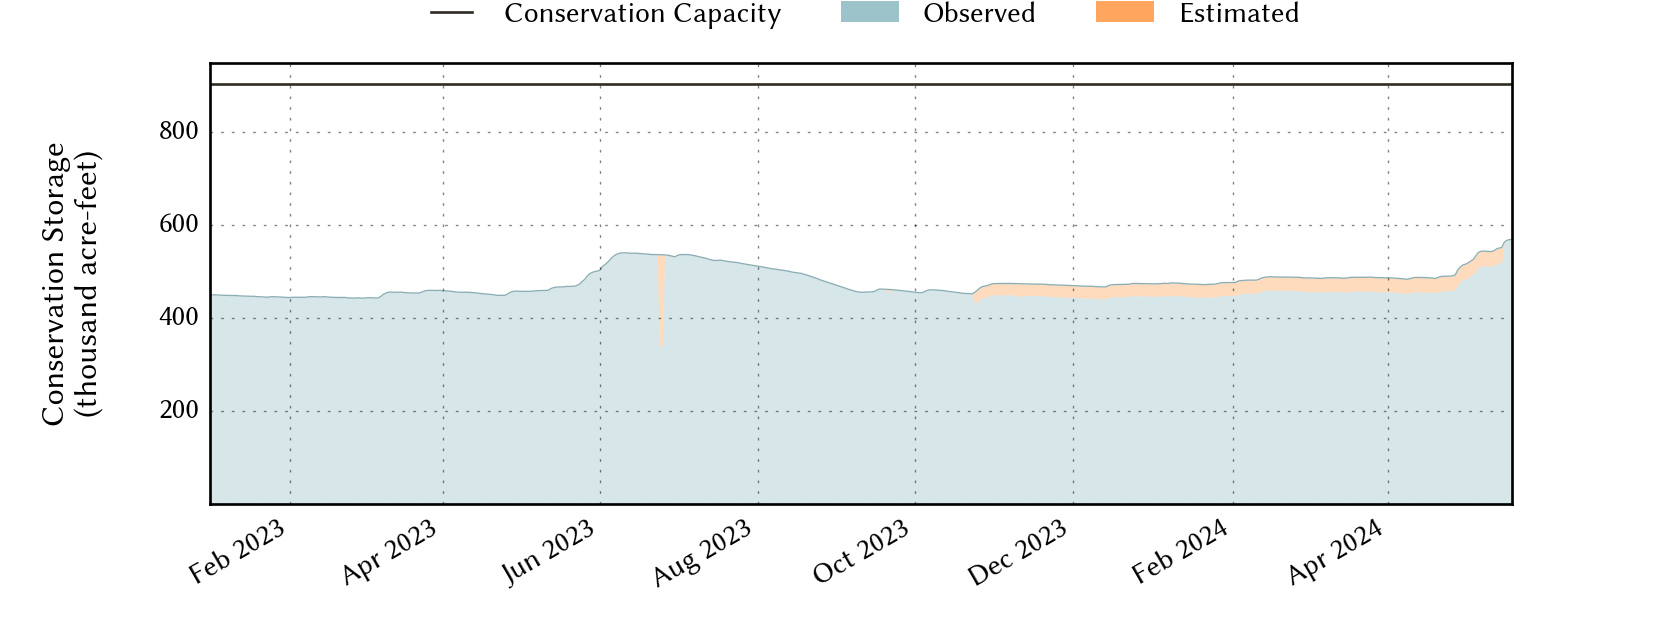
| Today | 2024-04-28 | 54.6 | 495,731 | 493,187 | 903,870 |
| Yesterday | 2024-04-27 | 53.5 | 486,473 | 483,929 | 903,870 |
| 2 days ago | 2024-04-26 | 53.4 | 485,174 | 482,630 | 903,870 |
| 1 week ago | 2024-04-21 | 53.3 | 484,456 | 481,912 | 903,870 |
| 1 month ago | 2024-03-28 | 53.3 | 484,554 | 482,010 | 903,870 |
| 3 months ago | 2024-01-28 | 52.4 | 476,323 | 473,779 | 903,870 |
| 6 months ago | 2023-10-28 | 51.8 | 471,126 | 468,582 | 903,870 |
| 1 year ago | 2023-04-28 | 50.6 | 459,698 | 457,154 | 903,870 |
*
Percent Full is based on Conservation Storage and Conservation Capacity and doesn't account for storage in flood pool.
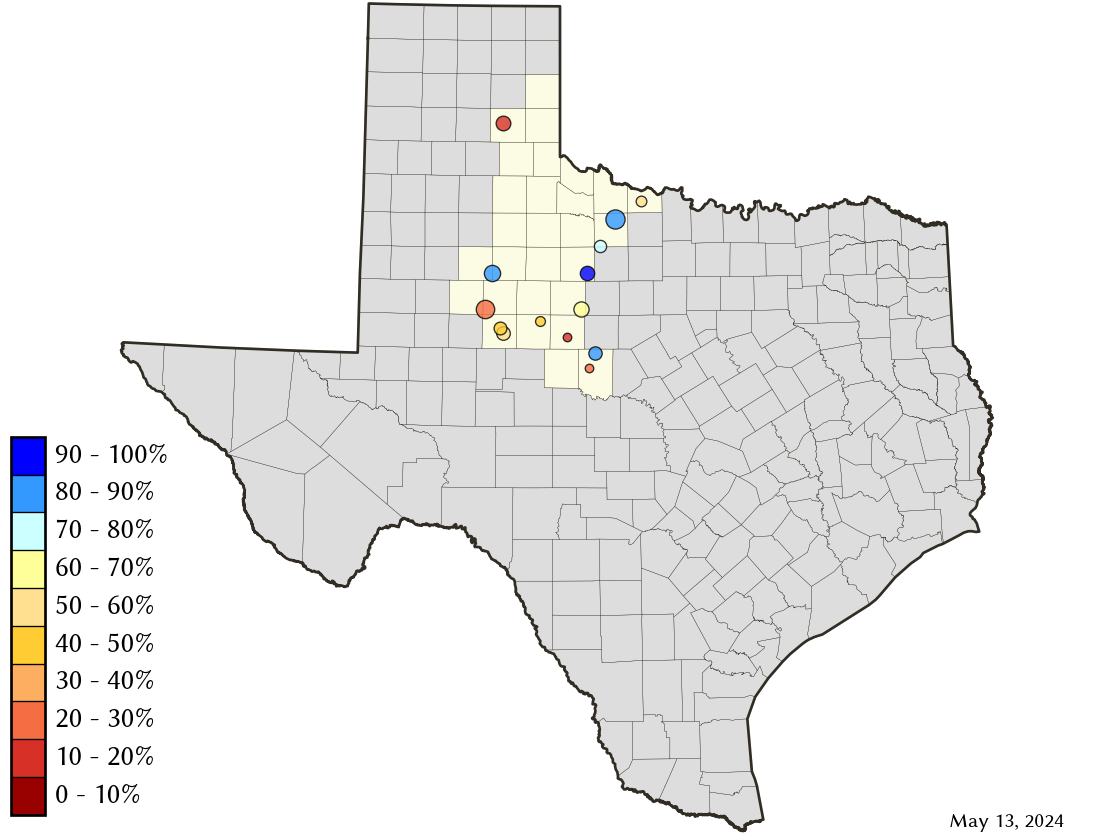
Area Map
Reservoir Storage
| Reservoir | Percent Full |
Water Level (ft) |
Height Above Conservation Pool (ft) |
Reservoir Storage (acre-ft) |
Conservation Storage (acre-ft) |
Conservation Capacity (acre-ft) |
Surface Area (acres) |
|---|---|---|---|---|---|---|---|
| Abilene | 11.6 | 1,993.64 | -18.66 | 920 | 920 | 7,900 | 167 |
| Alan Henry | 86.9 | 2,215.21 | -4.79 | 83,605 | 83,605 | 96,207 | 2,461 |
| Champion Creek | 57.2 | 2,068.89 | -14.11 | 23,800 | 23,800 | 41,580 | 1,032 |
| Coleman | 59.8 | 1,708.02 | -9.48 | 22,770 | 22,752 | 38,075 | 1,370 |
| Colorado City | 46.5 | 2,056.83 | -13.37 | 14,306 | 14,306 | 30,758 | - n.a. - |
| Fort Phantom Hill | 67.0 | 1,629.14 | -6.76 | 46,959 | 46,953 | 70,030 | 2,983 |
| Greenbelt | 11.3 | 2,618.01 | -45.99 | 7,195 | 6,763 | 59,968 | 464 |
| Hords Creek | 21.4 | 1,879.15 | -20.85 | 1,736 | 1,733 | 8,109 | 165 |
| J B Thomas | 19.4 | 2,225.70 | -32.30 | 39,527 | 38,854 | 199,931 | 3,061 |
| Kemp | 77.7 | 1,140.52 | -3.48 | 190,658 | 190,532 | 245,307 | 10,393 |
| Millers Creek | 50.4 | 1,326.11 | -7.89 | 14,770 | 13,487 | 26,768 | 1,208 |
| North Fork Buffalo Creek | 34.7 | 1,039.66 | -8.34 | 5,348 | 5,348 | 15,400 | 744 |
| Stamford | 74.8 | 1,414.23 | -2.57 | 38,590 | 38,587 | 51,570 | 4,142 |
| Sweetwater | 45.2 | 2,103.06 | -13.44 | 5,547 | 5,547 | 12,267 | 371 |