South-Central Climate Division Reservoirs: Monitored Water Supply Reservoirs are 43.4% full on 2024-04-28
Historical Data
| Date | Percent Full |
Reservoir Storage (acre-ft) |
Conservation Storage (acre-ft) |
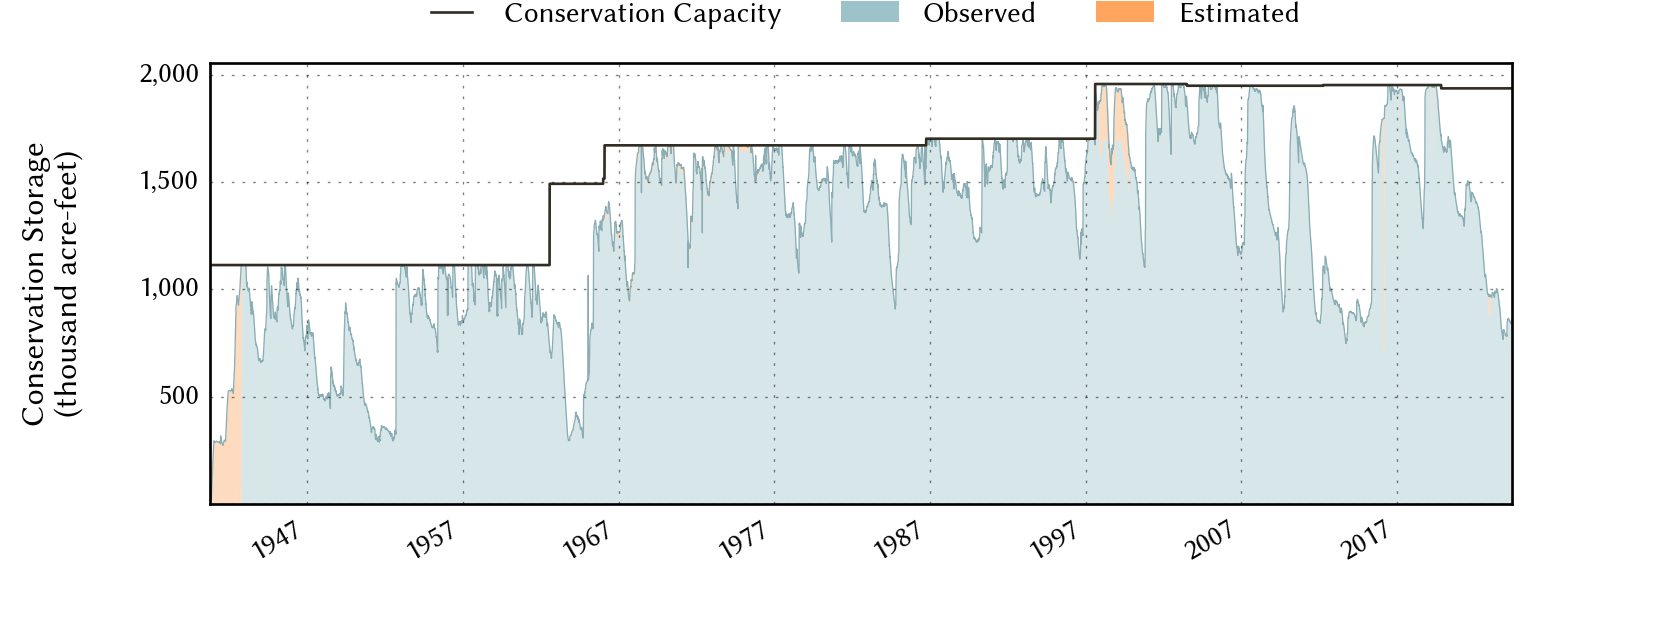
Conservation Capacity (acre-ft) |
|
|---|---|---|---|---|---|
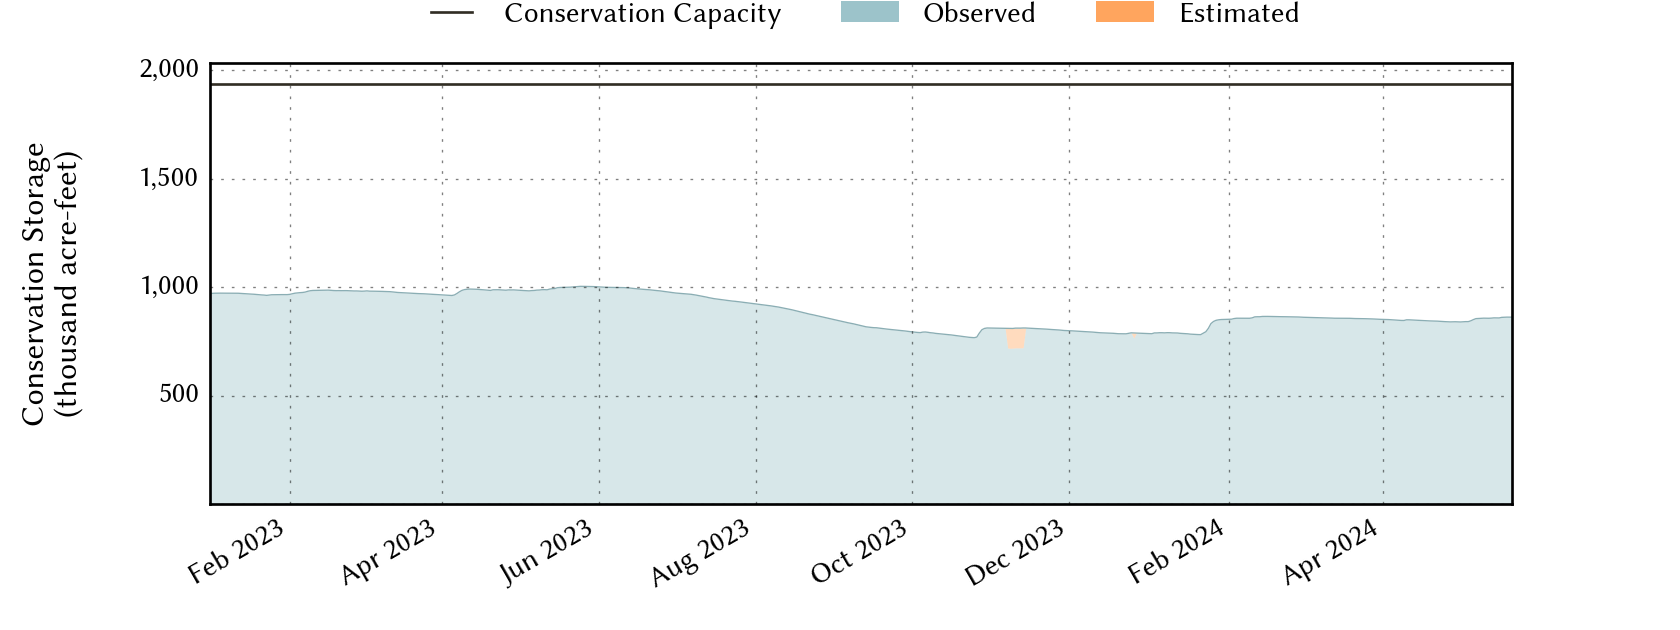
| Today | 2024-04-28 | 43.4 | 873,769 | 839,933 | 1,936,953 |
| Yesterday | 2024-04-27 | 43.4 | 875,691 | 839,817 | 1,936,953 |
| 2 days ago | 2024-04-26 | 43.4 | 878,609 | 840,320 | 1,936,953 |
| 1 week ago | 2024-04-21 | 43.6 | 882,282 | 844,114 | 1,936,953 |
| 1 month ago | 2024-03-28 | 44.1 | 876,393 | 853,325 | 1,936,953 |
| 3 months ago | 2024-01-28 | 43.9 | 868,229 | 849,394 | 1,936,953 |
| 6 months ago | 2023-10-28 | 41.5 | 821,545 | 803,833 | 1,936,953 |
| 1 year ago | 2023-04-28 | 51.0 | 1,017,352 | 987,076 | 1,936,953 |
*
Percent Full is based on Conservation Storage and Conservation Capacity and doesn't account for storage in flood pool.
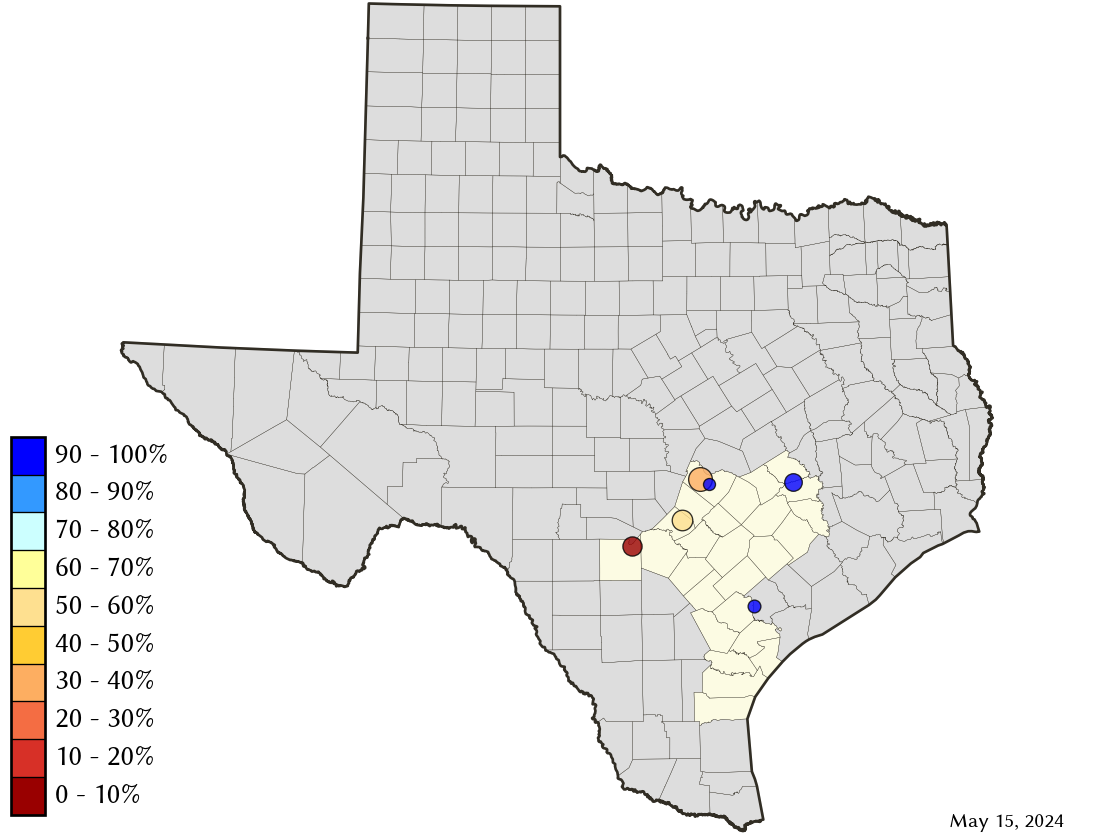
Area Map
Reservoir Storage
| Reservoir | Percent Full |
Water Level (ft) |
Height Above Conservation Pool (ft) |
Reservoir Storage (acre-ft) |
Conservation Storage (acre-ft) |
Conservation Capacity (acre-ft) |
Surface Area (acres) |
|---|---|---|---|---|---|---|---|
| Austin | 95.6 | 492.13 | -0.67 | 23,535 | 22,926 | 23,972 | 1,541 |
| Canyon | 58.8 | 886.61 | -22.39 | 222,608 | 222,537 | 378,781 | 5,808 |
| Coleto Creek | 97.0 | 97.60 | -0.40 | 30,102 | 30,102 | 31,040 | 2,597 |
| Medina | 2.8 | 972.58 | -91.62 | 7,032 | 7,032 | 254,823 | 613 |
| Somerville | 100.0 | 239.39 | 1.39 | 166,417 | 150,293 | 150,293 | - n.a. - |
| Travis | 37.1 | 630.28 | -50.72 | 424,075 | 407,043 | 1,098,044 | 9,217 |