Fort Worth Area Reservoirs: Monitored Water Supply Reservoirs are 92.3% full on 2024-04-28
Historical Data
| Date | Percent Full |
Reservoir Storage (acre-ft) |
Conservation Storage (acre-ft) |
Conservation Capacity (acre-ft) |
|
|---|---|---|---|---|---|
| Today | 2024-04-28 | 92.3 | 2,351,810 | 2,261,715 | 2,451,597 |
| Yesterday | 2024-04-27 | 92.0 | 2,315,725 | 2,256,395 | 2,451,597 |
| 2 days ago | 2024-04-26 | 92.0 | 2,305,051 | 2,256,091 | 2,451,597 |
| 1 week ago | 2024-04-21 | 91.9 | 2,310,088 | 2,251,918 | 2,451,597 |
| 1 month ago | 2024-03-28 | 91.5 | 2,329,333 | 2,244,347 | 2,451,597 |
| 3 months ago | 2024-01-28 | 90.5 | 2,266,950 | 2,219,201 | 2,451,597 |
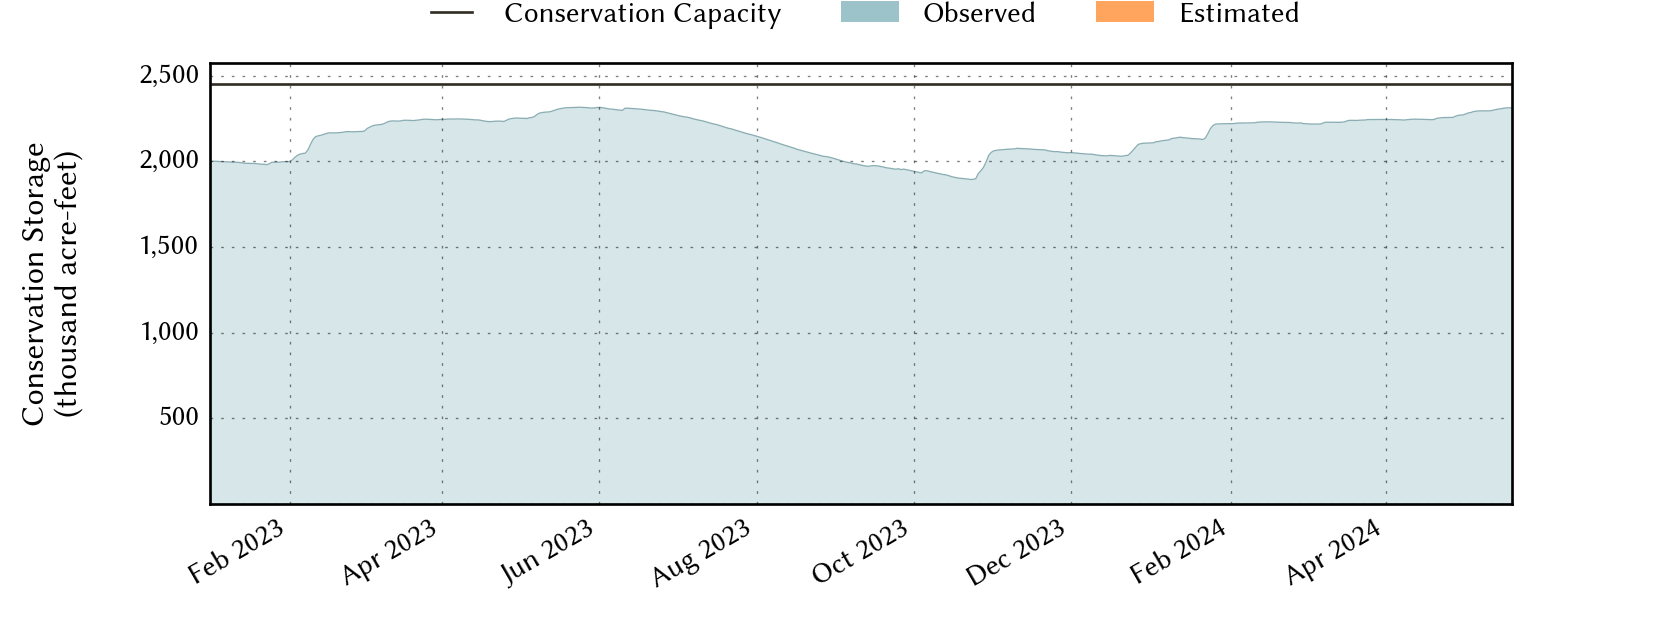
| 6 months ago | 2023-10-28 | 80.1 | 2,002,576 | 1,964,594 | 2,451,597 |
| 1 year ago | 2023-04-28 | 91.7 | 2,295,818 | 2,249,255 | 2,451,597 |
*
Percent Full is based on Conservation Storage and Conservation Capacity and doesn't account for storage in flood pool.
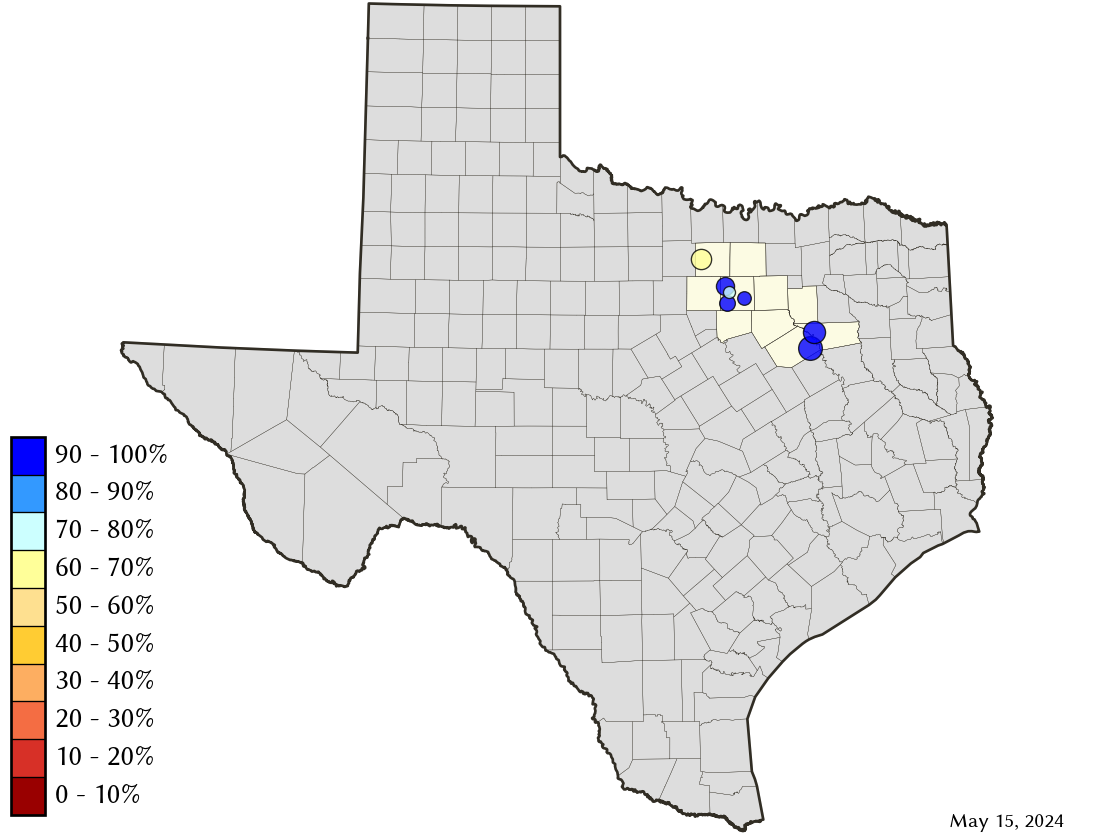
Area Map
Reservoir Storage
| Reservoir | Percent Full |
Water Level (ft) |
Height Above Conservation Pool (ft) |
Reservoir Storage (acre-ft) |
Conservation Storage (acre-ft) |
Conservation Capacity (acre-ft) |
Surface Area (acres) |
|---|---|---|---|---|---|---|---|
| Arlington | 100.0 | 552.23 | 2.23 | 44,542 | 40,157 | 40,157 | - n.a. - |
| Benbrook | 100.0 | 695.63 | 1.63 | 91,862 | 85,648 | 85,648 | - n.a. - |
| Bridgeport | 59.3 | 821.83 | -14.17 | 220,861 | 220,861 | 372,183 | 9,122 |
| Cedar Creek | 100.0 | 322.64 | 0.64 | 665,957 | 644,686 | 644,686 | - n.a. - |
| Eagle Mountain | 83.6 | 645.62 | -3.48 | 154,811 | 154,811 | 185,087 | 8,218 |
| Richland-Chambers | 100.0 | 315.53 | 0.53 | 1,148,566 | 1,099,417 | 1,099,417 | - n.a. - |
| Worth | 66.1 | 591.47 | -2.53 | 25,211 | 16,135 | 24,419 | 3,100 |