Region-C Planning Region Reservoirs: Monitored Water Supply Reservoirs are 96.3% full on 2024-04-28
Historical Data
| Date | Percent Full |
Reservoir Storage (acre-ft) |
Conservation Storage (acre-ft) |
Conservation Capacity (acre-ft) |
|
|---|---|---|---|---|---|
| Today | 2024-04-28 | 96.3 | 8,047,976 | 6,534,352 | 6,783,467 |
| Yesterday | 2024-04-27 | 96.0 | 7,940,483 | 6,514,306 | 6,783,467 |
| 2 days ago | 2024-04-26 | 96.0 | 7,924,905 | 6,512,605 | 6,783,467 |
| 1 week ago | 2024-04-21 | 95.9 | 7,937,865 | 6,502,777 | 6,783,467 |
| 1 month ago | 2024-03-28 | 94.6 | 7,810,467 | 6,415,056 | 6,783,467 |
| 3 months ago | 2024-01-28 | 93.4 | 7,671,675 | 6,334,322 | 6,783,467 |
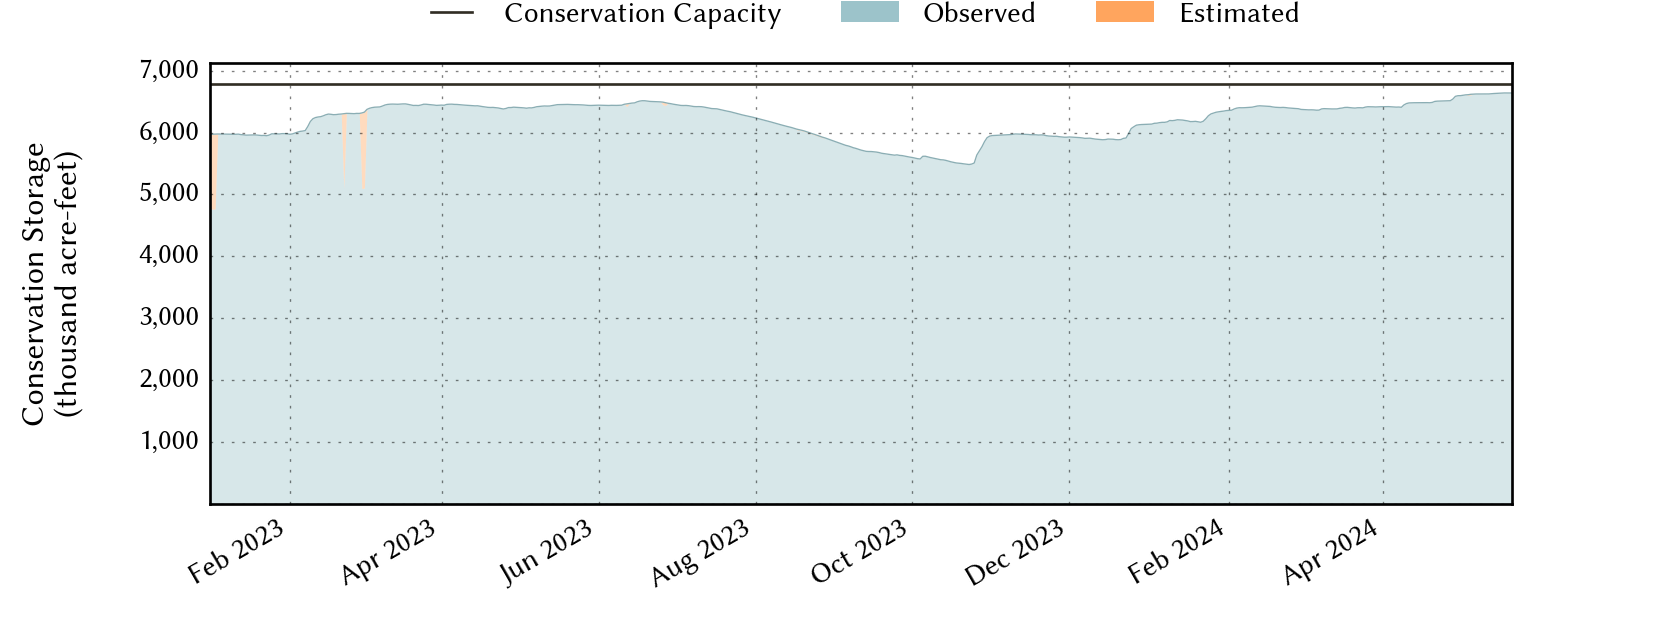
| 6 months ago | 2023-10-28 | 85.1 | 6,995,095 | 5,769,941 | 6,783,467 |
| 1 year ago | 2023-04-28 | 94.4 | 7,672,551 | 6,403,259 | 6,783,467 |
*
Percent Full is based on Conservation Storage and Conservation Capacity and doesn't account for storage in flood pool.
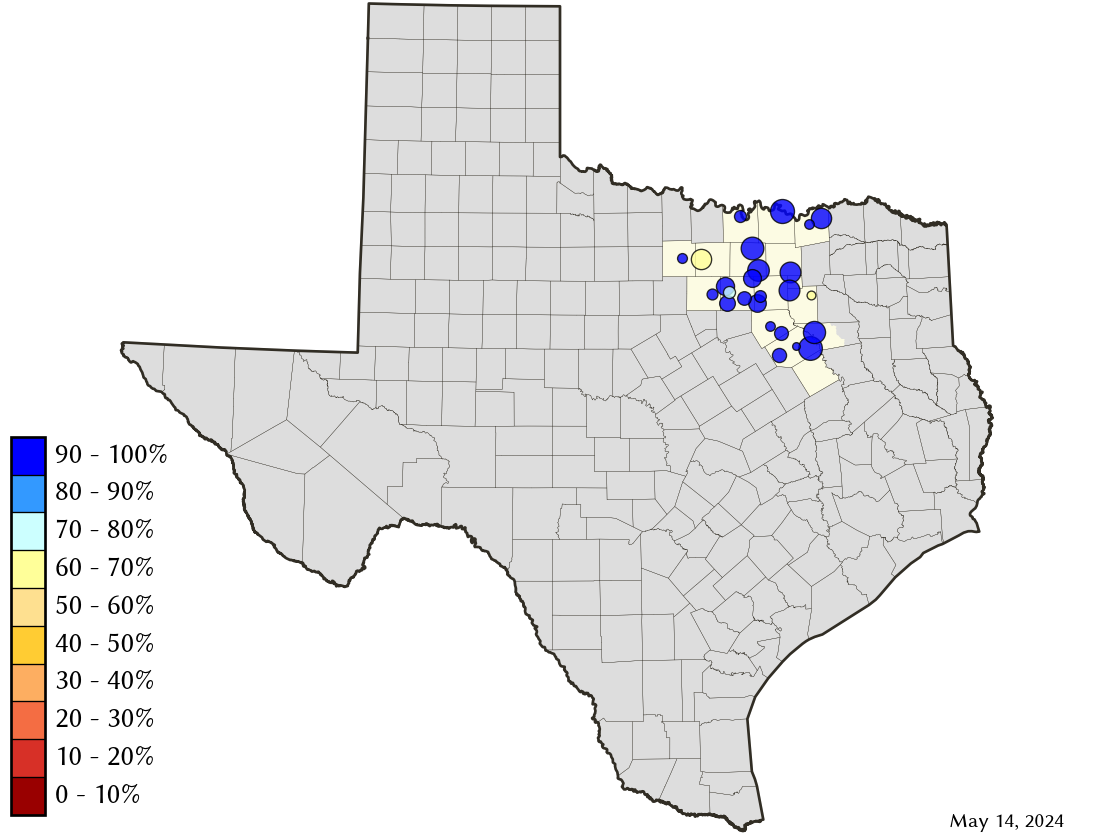
Area Map
Reservoir Storage
| Reservoir | Percent Full |
Water Level (ft) |
Height Above Conservation Pool (ft) |
Reservoir Storage (acre-ft) |
Conservation Storage (acre-ft) |
Conservation Capacity (acre-ft) |
Surface Area (acres) |
|---|---|---|---|---|---|---|---|
| Arlington | 100.0 | 552.23 | 2.23 | 44,542 | 40,157 | 40,157 | - n.a. - |
| Bardwell | 100.0 | 426.50 | 5.50 | 64,094 | 43,856 | 43,856 | 4,016 |
| Benbrook | 100.0 | 695.63 | 1.63 | 91,862 | 85,648 | 85,648 | - n.a. - |
| Bois d'Arc | 95.8 | 533.05 | -0.95 | 352,341 | 352,341 | 367,609 | 16,115 |
| Bonham | 100.0 | 565.54 | 0.54 | 11,624 | 11,027 | 11,027 | 1,098 |
| Bridgeport | 59.3 | 821.83 | -14.17 | 220,861 | 220,861 | 372,183 | 9,122 |
| Cedar Creek | 100.0 | 322.64 | 0.64 | 665,957 | 644,686 | 644,686 | - n.a. - |
| Eagle Mountain | 83.6 | 645.62 | -3.48 | 154,811 | 154,811 | 185,087 | 8,218 |
| Grapevine | 100.0 | 537.36 | 2.36 | 179,315 | 163,064 | 163,064 | - n.a. - |
| Halbert | 88.9 | 366.81 | -1.19 | 5,362 | 5,362 | 6,033 | 550 |
| Hubert H Moss | 100.0 | 715.86 | 0.86 | 25,093 | 24,058 | 24,058 | - n.a. - |
| Joe Pool | 100.0 | 523.32 | 1.32 | 160,023 | 149,629 | 149,629 | 6,978 |
| Lavon | 100.0 | 493.36 | 1.36 | 441,161 | 409,757 | 409,757 | 21,345 |
| Lewisville | 100.0 | 523.49 | 1.49 | 639,919 | 563,228 | 563,228 | - n.a. - |
| Lost Creek | 94.0 | 1,007.74 | -1.76 | 11,234 | 11,234 | 11,950 | - n.a. - |
| Mountain Creek | 100.0 | 458.05 | 1.05 | 25,938 | 22,850 | 22,850 | - n.a. - |
| Navarro Mills | 100.0 | 427.47 | 2.97 | 64,668 | 49,827 | 49,827 | - n.a. - |
| New Terrell City | 57.7 | 499.26 | -4.74 | 4,964 | 4,953 | 8,583 | 643 |
| Ray Hubbard | 100.0 | 435.85 | 0.35 | 446,971 | 439,559 | 439,559 | 21,410 |
| Ray Roberts | 100.0 | 633.56 | 1.06 | 818,921 | 788,167 | 788,167 | - n.a. - |
| Richland-Chambers | 100.0 | 315.53 | 0.53 | 1,148,566 | 1,099,417 | 1,099,417 | - n.a. - |
| Texoma 1 | 97.2 | 616.07 | -0.93 | 2,418,341 | 1,209,170 | 1,243,801 | 73,090 |
| Waxahachie | 100.0 | 533.03 | 1.53 | 12,702 | 11,060 | 11,060 | 719 |
| Weatherford | 75.8 | 891.75 | -4.25 | 13,495 | 13,495 | 17,812 | 954 |
| Worth | 66.1 | 591.47 | -2.53 | 25,211 | 16,135 | 24,419 | 3,100 |
footnotes
1
Lake Texoma straddles the border of Texas and Oklahoma, Texas has rights to 50% of Lake Texoma's total conservation capacity. Percent full, conservation storage and conservation capacity are based on the Texas share.