Austin Area Reservoirs: Monitored Water Supply Reservoirs are 44.6% full on 2024-04-28
Historical Data
| Date | Percent Full |
Reservoir Storage (acre-ft) |
Conservation Storage (acre-ft) |
Conservation Capacity (acre-ft) |
|
|---|---|---|---|---|---|
| Today | 2024-04-28 | 44.6 | 1,027,078 | 996,235 | 2,232,539 |
| Yesterday | 2024-04-27 | 44.5 | 1,024,599 | 993,756 | 2,232,539 |
| 2 days ago | 2024-04-26 | 44.5 | 1,024,681 | 993,838 | 2,232,539 |
| 1 week ago | 2024-04-21 | 44.6 | 1,026,741 | 995,898 | 2,232,539 |
| 1 month ago | 2024-03-28 | 44.1 | 1,015,675 | 984,832 | 2,232,539 |
| 3 months ago | 2024-01-28 | 43.5 | 1,001,812 | 970,969 | 2,232,539 |
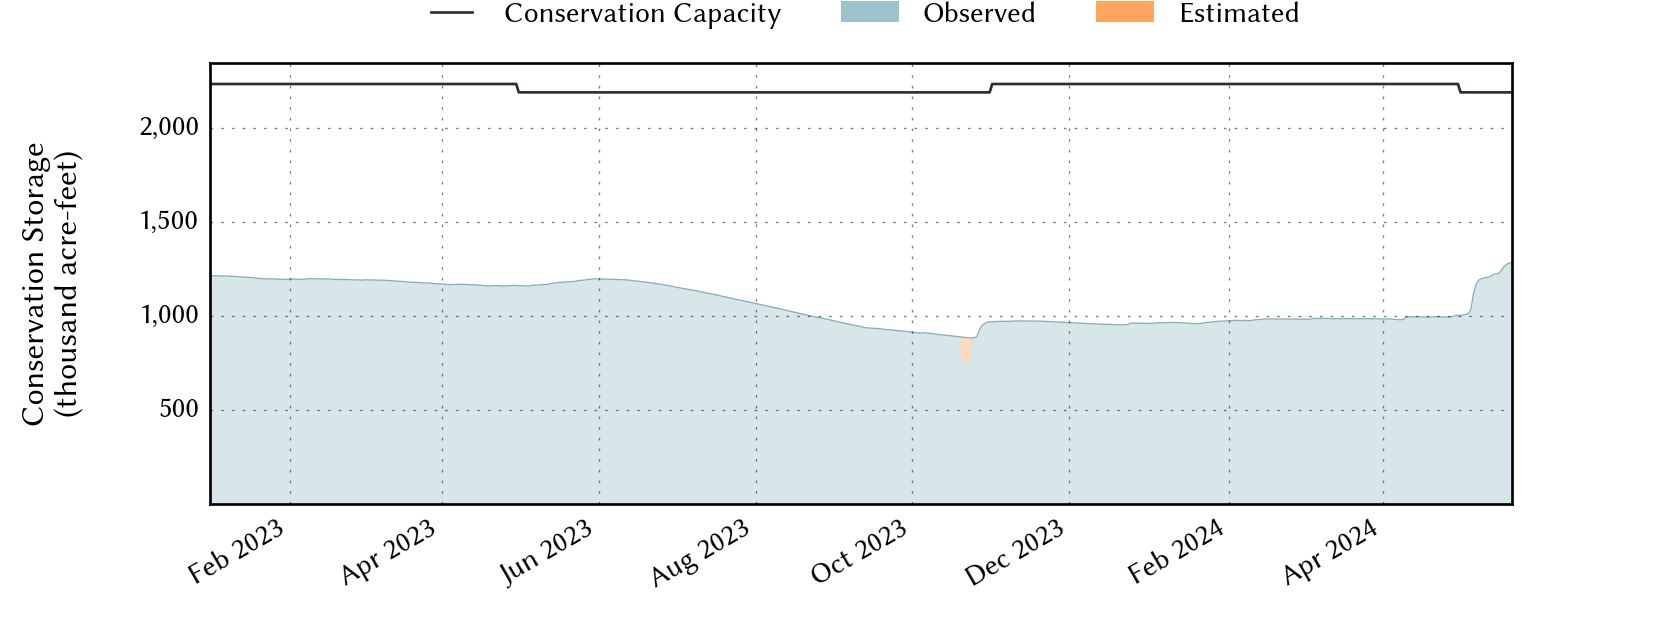
| 6 months ago | 2023-10-28 | 43.3 | 979,104 | 948,261 | 2,188,052 |
| 1 year ago | 2023-04-28 | 52.0 | 1,191,560 | 1,160,717 | 2,232,539 |
*
Percent Full is based on Conservation Storage and Conservation Capacity and doesn't account for storage in flood pool.
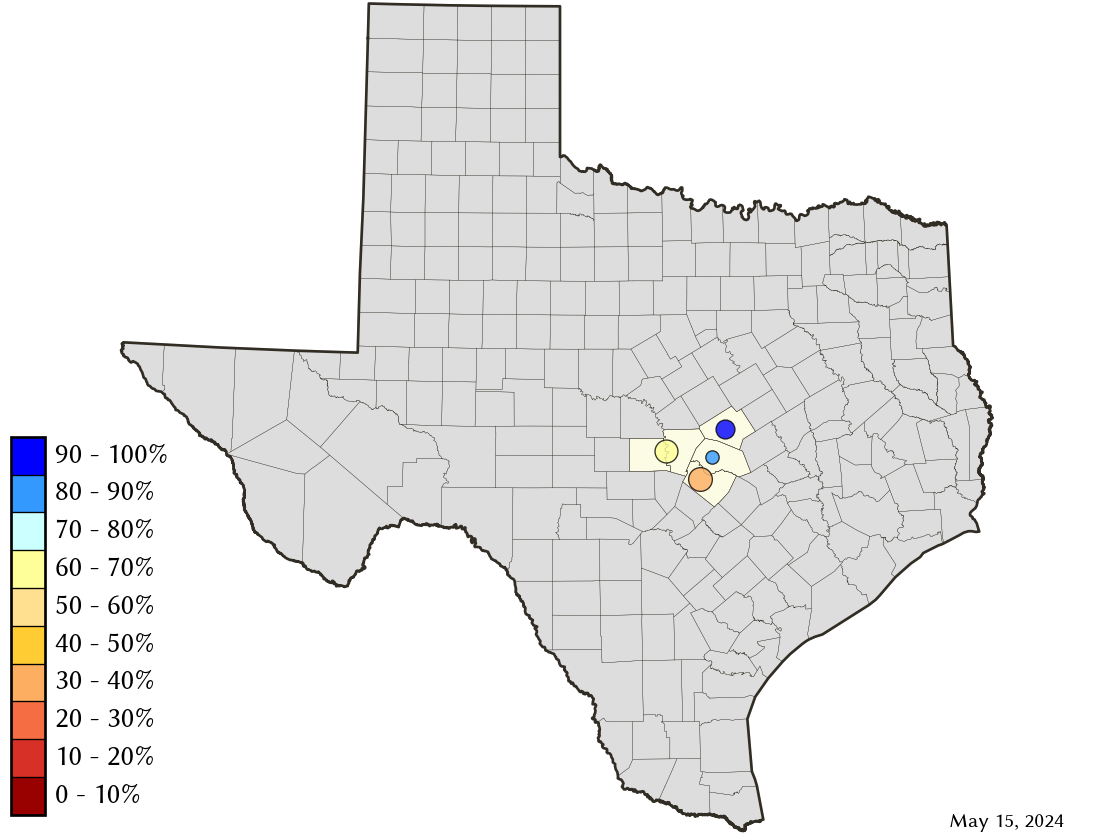
Area Map
Reservoir Storage
| Reservoir | Percent Full |
Water Level (ft) |
Height Above Conservation Pool (ft) |
Reservoir Storage (acre-ft) |
Conservation Storage (acre-ft) |
Conservation Capacity (acre-ft) |
Surface Area (acres) |
|---|---|---|---|---|---|---|---|
| Buchanan | 46.9 | 995.33 | -24.67 | 420,205 | 406,543 | 866,694 | 14,312 |
| Georgetown | 80.0 | 784.78 | -6.22 | 30,456 | 30,393 | 38,005 | 1,142 |
| Stillhouse Hollow | 66.3 | 607.84 | -14.16 | 152,342 | 152,256 | 229,796 | 4,608 |
| Travis | 37.1 | 630.28 | -50.72 | 424,075 | 407,043 | 1,098,044 | 9,217 |