Coastal-Bend Planning Region Reservoirs: Monitored Water Supply Reservoirs are 27.7% full on 2024-04-28
Historical Data
| Date | Percent Full |
Reservoir Storage (acre-ft) |
Conservation Storage (acre-ft) |
Conservation Capacity (acre-ft) |
|
|---|---|---|---|---|---|
| Today | 2024-04-28 | 27.7 | 255,107 | 254,828 | 918,882 |
| Yesterday | 2024-04-27 | 27.7 | 254,982 | 254,703 | 918,882 |
| 2 days ago | 2024-04-26 | 27.8 | 255,925 | 255,646 | 918,882 |
| 1 week ago | 2024-04-21 | 28.4 | 261,324 | 261,045 | 918,882 |
| 1 month ago | 2024-03-28 | 29.5 | 271,247 | 270,968 | 918,882 |
| 3 months ago | 2024-01-28 | 30.9 | 284,435 | 284,156 | 918,882 |
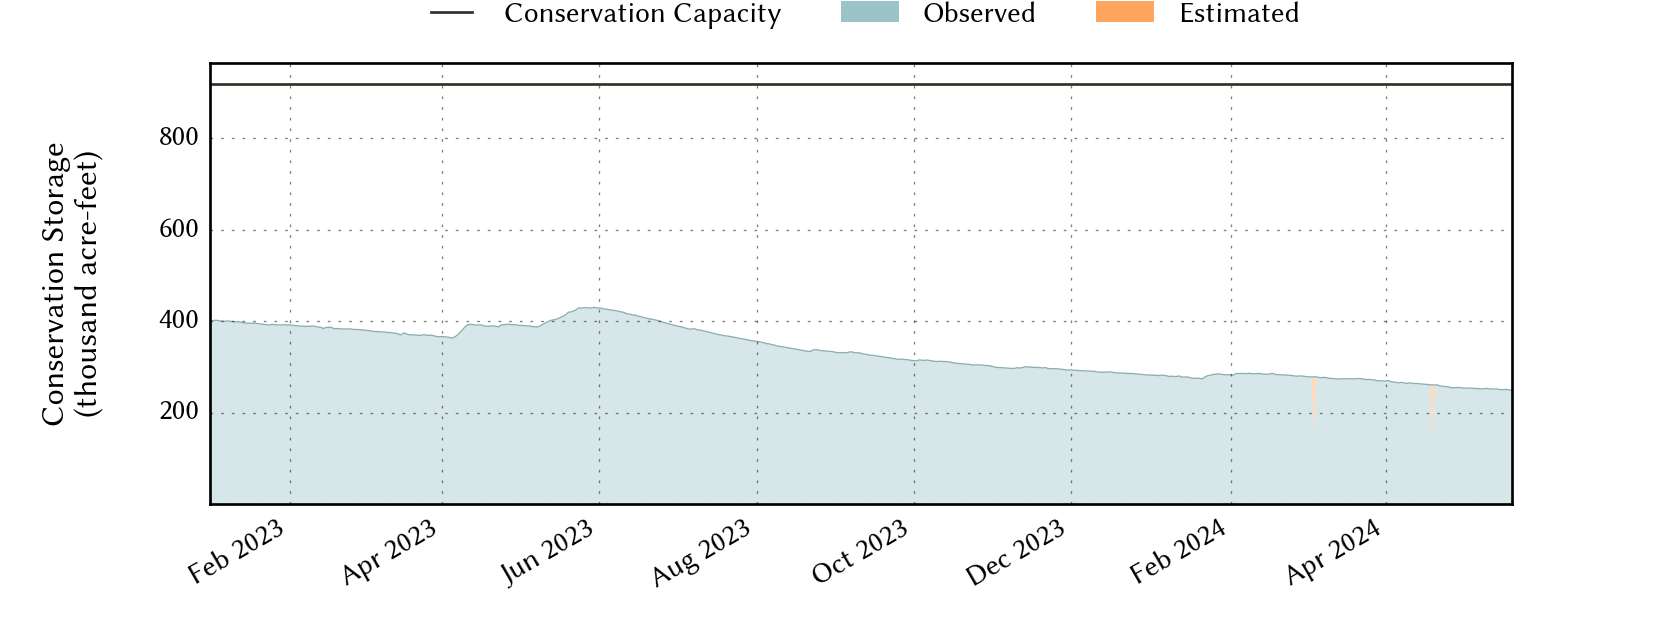
| 6 months ago | 2023-10-28 | 33.0 | 303,781 | 303,502 | 918,882 |
| 1 year ago | 2023-04-28 | 42.7 | 392,394 | 392,115 | 918,882 |
*
Percent Full is based on Conservation Storage and Conservation Capacity and doesn't account for storage in flood pool.
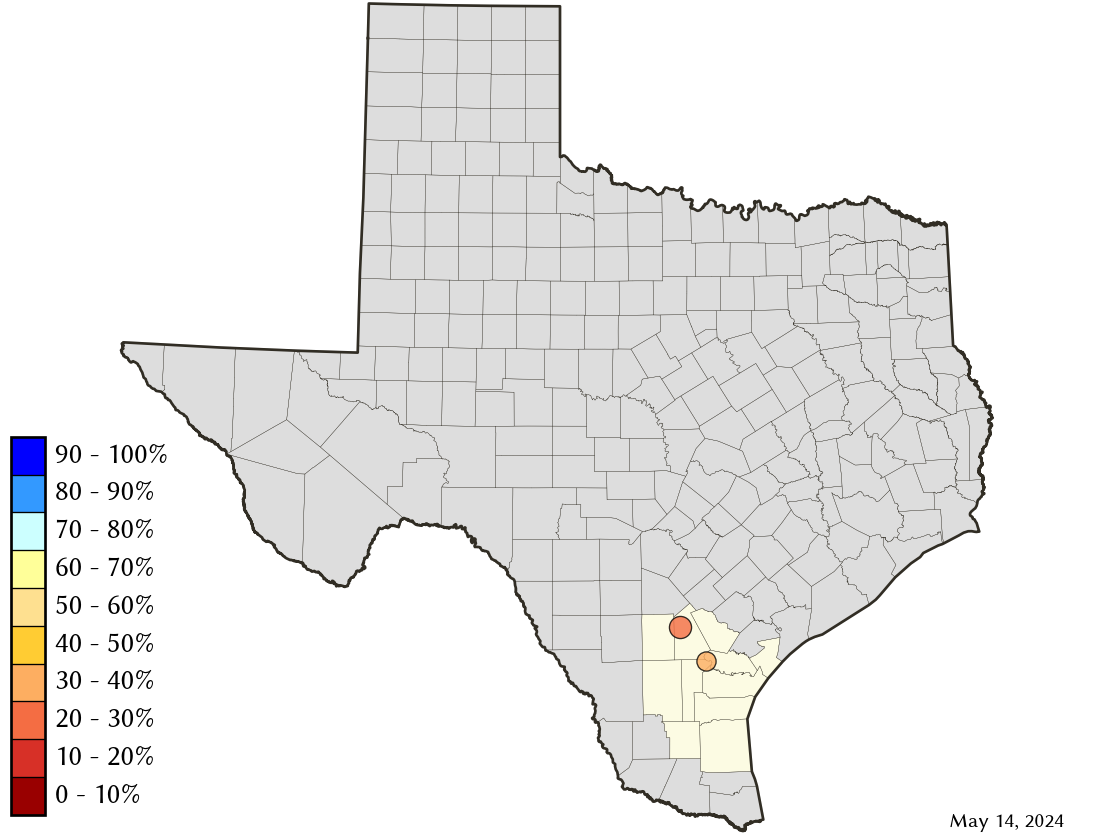
Area Map
Reservoir Storage
| Reservoir | Percent Full |
Water Level (ft) |
Height Above Conservation Pool (ft) |
Reservoir Storage (acre-ft) |
Conservation Storage (acre-ft) |
Conservation Capacity (acre-ft) |
Surface Area (acres) |
|---|---|---|---|---|---|---|---|
| Choke Canyon | 23.0 | 191.72 | -28.78 | 152,610 | 152,609 | 662,820 | 10,613 |
| Corpus Christi | 39.9 | 84.63 | -9.37 | 102,497 | 102,219 | 256,062 | 12,484 |