Reservoir Storage Summary for Climate Divisions on 2024-05-02
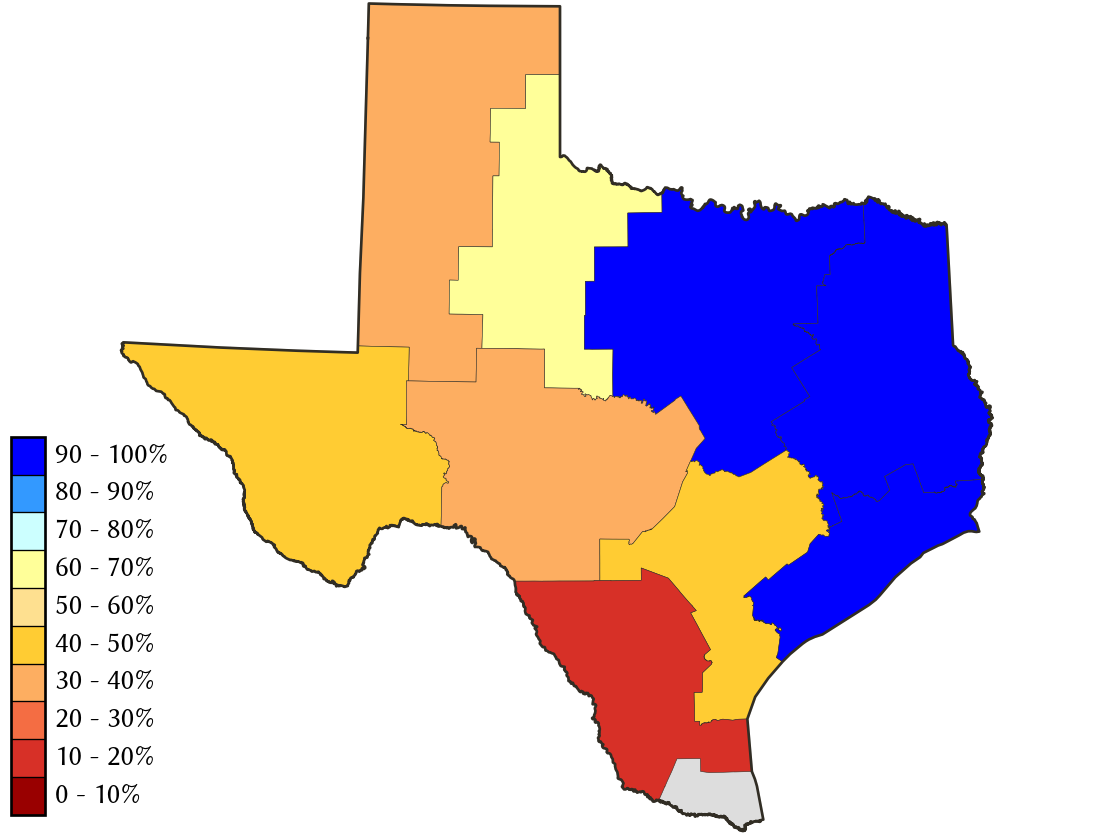
Percent Full
| Today | Yesterday | 2 days ago | 1 week ago | 1 month ago | 3 months ago | 6 months ago | 1 year ago | |
|---|---|---|---|---|---|---|---|---|
| 2024-05-02 | 2024-05-01 | 2024-04-30 | 2024-04-25 | 2024-04-02 | 2024-02-02 | 2023-11-02 | 2023-05-02 | |
| East Texas | 96.8 | 96.8 | 96.6 | 96.4 | 91.7 | 95.3 | 85.2 | 99.2 |
| Edwards Plateau | 31.5 | 31.5 | 31.2 | 31.1 | 31.3 | 30.2 | 32.2 | 38.4 |
| High Plains | 36.3 | 36.3 | 36.3 | 36.5 | 36.8 | 37.1 | 37.4 | 24.3 |
| Low Rolling Plains | 55.6 | 55.6 | 55.5 | 53.3 | 53.2 | 52.5 | 52.4 | 50.6 |
| North Central | 92.8 | 92.8 | 92.8 | 91.7 | 90.5 | 89.4 | 84.6 | 88.2 |
| South | 17.1 | 17.1 | 17.3 | 17.6 | 21.0 | 22.5 | 18.8 | 30.5 |
| South Central | 43.3 | 43.3 | 43.4 | 43.4 | 43.9 | 44.0 | 41.9 | 50.9 |
| Trans Pecos | 41.2 | 41.2 | 41.3 | 41.4 | 41.4 | 41.7 | 38.5 | 57.5 |
| Upper Coast | 97.2 | 97.2 | 97.4 | 97.8 | 99.5 | 99.7 | 85.1 | 99.9 |
*
Percent Full is based on Conservation Storage and Conservation Capacity.
Recent Conditions
| Percent Full |
Reservoir Storage (acre-ft) |
Conservation Storage (acre-ft) |
Conservation Capacity (acre-ft) |
|
|---|---|---|---|---|
| East Texas | 96.8 | 12,756,889 | 9,774,294 | 10,101,935 |
| Edwards Plateau | 31.5 | 1,523,109 | 1,327,642 | 4,217,160 |
| High Plains | 36.3 | 271,750 | 231,370 | 637,396 |
| Low Rolling Plains | 55.6 | 505,247 | 502,703 | 903,870 |
| North Central | 92.8 | 12,274,825 | 10,193,361 | 10,984,350 |
| South | 17.1 | 688,229 | 423,157 | 2,481,249 |
| South Central | 43.3 | 865,638 | 839,460 | 1,936,953 |
| Trans Pecos | 41.2 | 62,321 | 62,321 | 151,110 |
| Upper Coast | 97.2 | 311,823 | 283,205 | 291,293 |
**
The Lower Valley climate division has no contributing Reservoirs present.