Austin Area Reservoirs: Monitored Water Supply Reservoirs are 45.8% full on 2024-05-01
Historical Data
| Date | Percent Full |
Reservoir Storage (acre-ft) |
Conservation Storage (acre-ft) |
Conservation Capacity (acre-ft) |
|
|---|---|---|---|---|---|
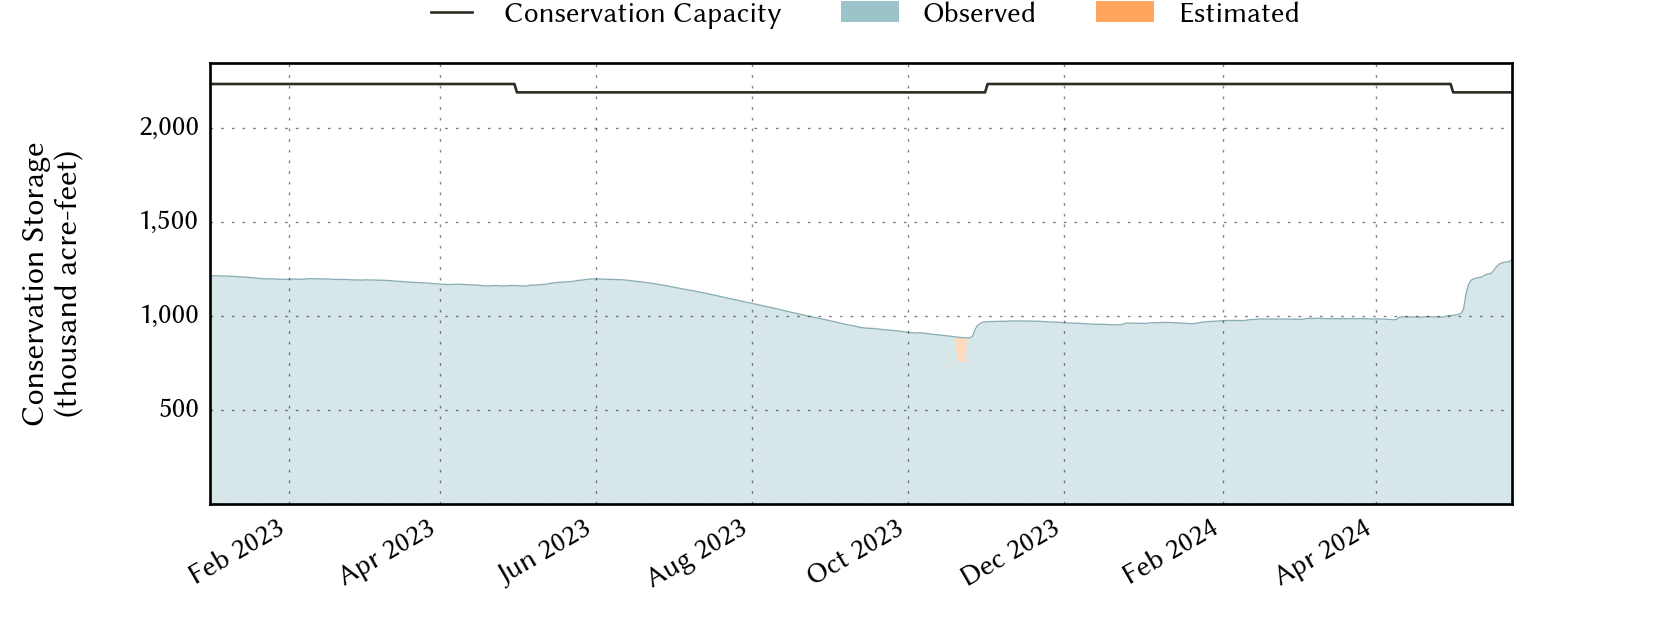
| Today | 2024-05-01 | 45.8 | 1,033,078 | 1,002,235 | 2,188,052 |
| Yesterday | 2024-04-30 | 44.9 | 1,032,821 | 1,001,978 | 2,232,539 |
| 2 days ago | 2024-04-29 | 44.8 | 1,031,692 | 1,000,849 | 2,232,539 |
| 1 week ago | 2024-04-24 | 44.5 | 1,025,173 | 994,330 | 2,232,539 |
| 1 month ago | 2024-04-01 | 44.1 | 1,014,447 | 983,604 | 2,232,539 |
| 3 months ago | 2024-02-01 | 43.6 | 1,004,825 | 973,982 | 2,232,539 |
| 6 months ago | 2023-11-01 | 43.4 | 999,892 | 969,049 | 2,232,539 |
| 1 year ago | 2023-05-01 | 53.0 | 1,191,321 | 1,160,478 | 2,188,052 |
*
Percent Full is based on Conservation Storage and Conservation Capacity and doesn't account for storage in flood pool.
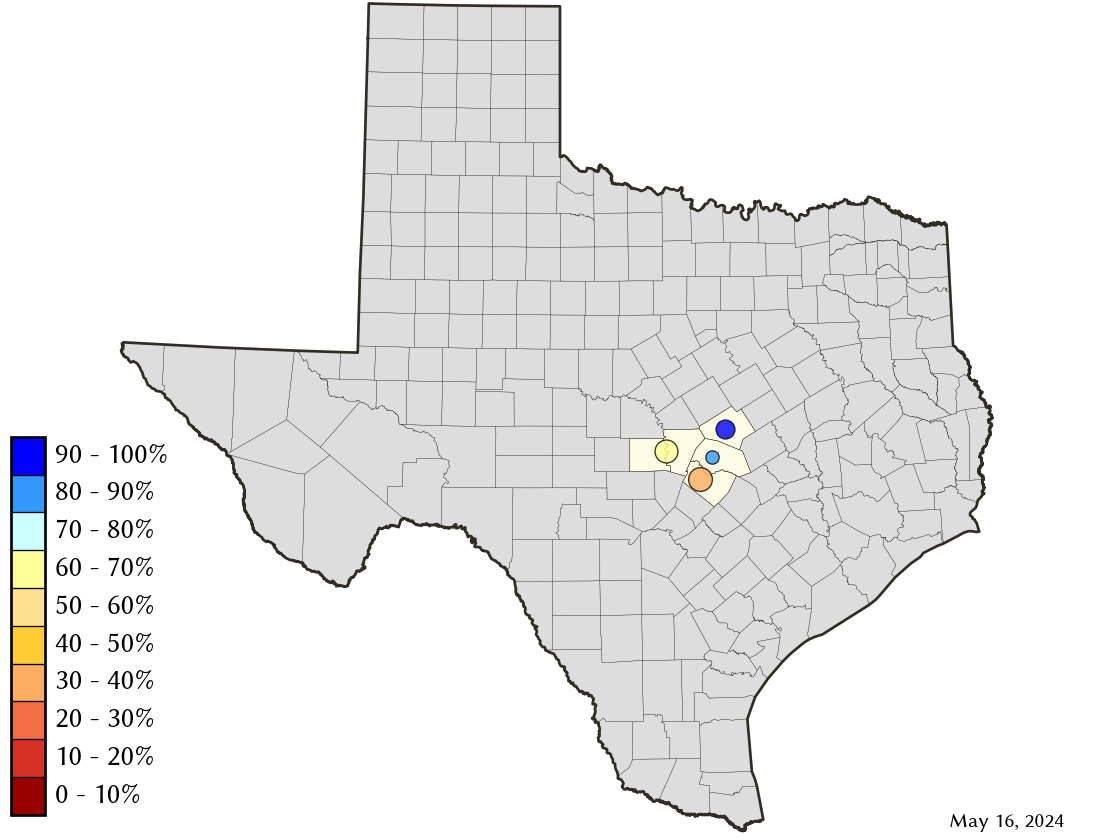
Area Map
Reservoir Storage
| Reservoir | Percent Full |
Water Level (ft) |
Height Above Conservation Pool (ft) |
Reservoir Storage (acre-ft) |
Conservation Storage (acre-ft) |
Conservation Capacity (acre-ft) |
Surface Area (acres) |
|---|---|---|---|---|---|---|---|
| Buchanan | 49.7 | 995.46 | -22.54 | 422,068 | 408,406 | 822,207 | 14,347 |
| Georgetown | 80.7 | 785.02 | -5.98 | 30,731 | 30,668 | 38,005 | 1,149 |
| Stillhouse Hollow | 67.9 | 608.65 | -13.35 | 156,112 | 156,026 | 229,796 | 4,700 |
| Travis | 37.1 | 630.29 | -50.71 | 424,167 | 407,135 | 1,098,044 | 9,218 |