Lower-Colorado Planning Region Reservoirs: Monitored Water Supply Reservoirs are 46.6% full on 2024-05-01
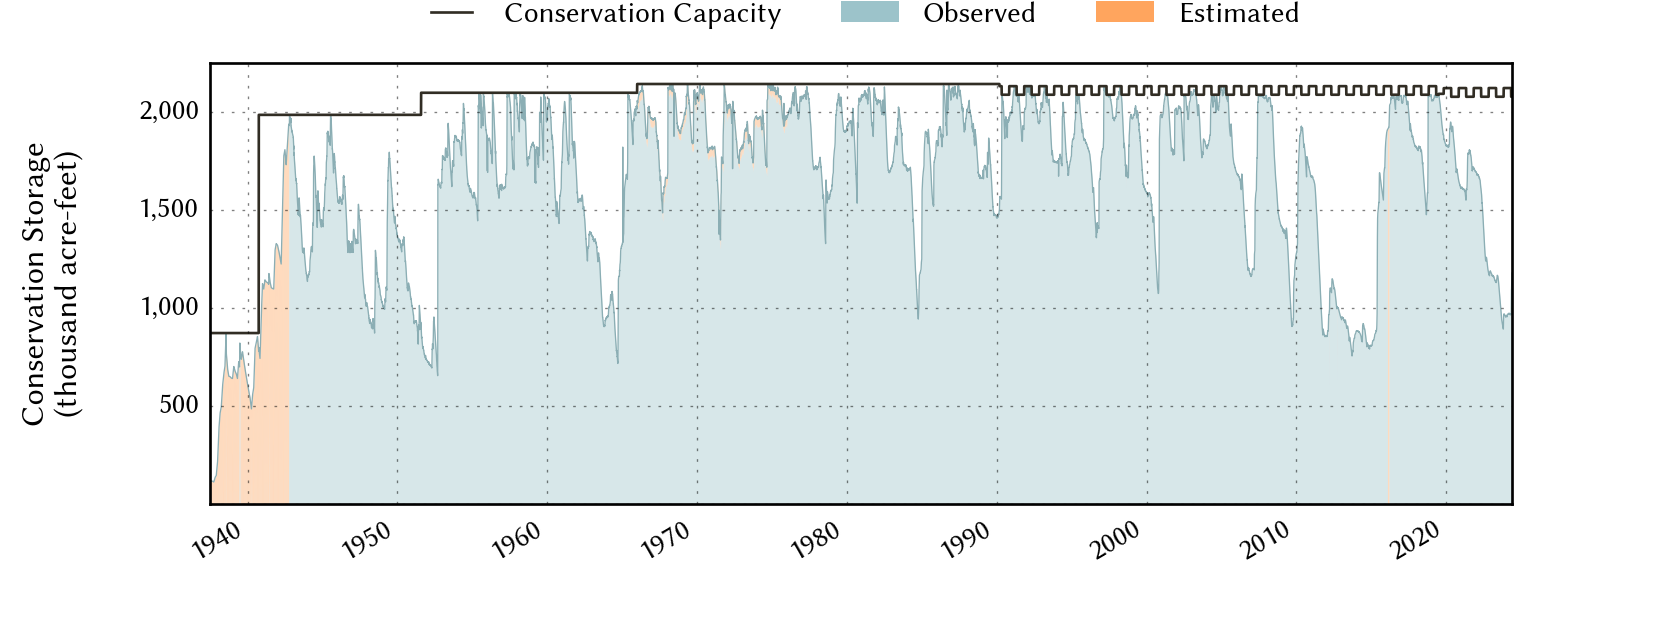
Historical Data
| Date | Percent Full |
Reservoir Storage (acre-ft) |
Conservation Storage (acre-ft) |
Conservation Capacity (acre-ft) |
|
|---|---|---|---|---|---|
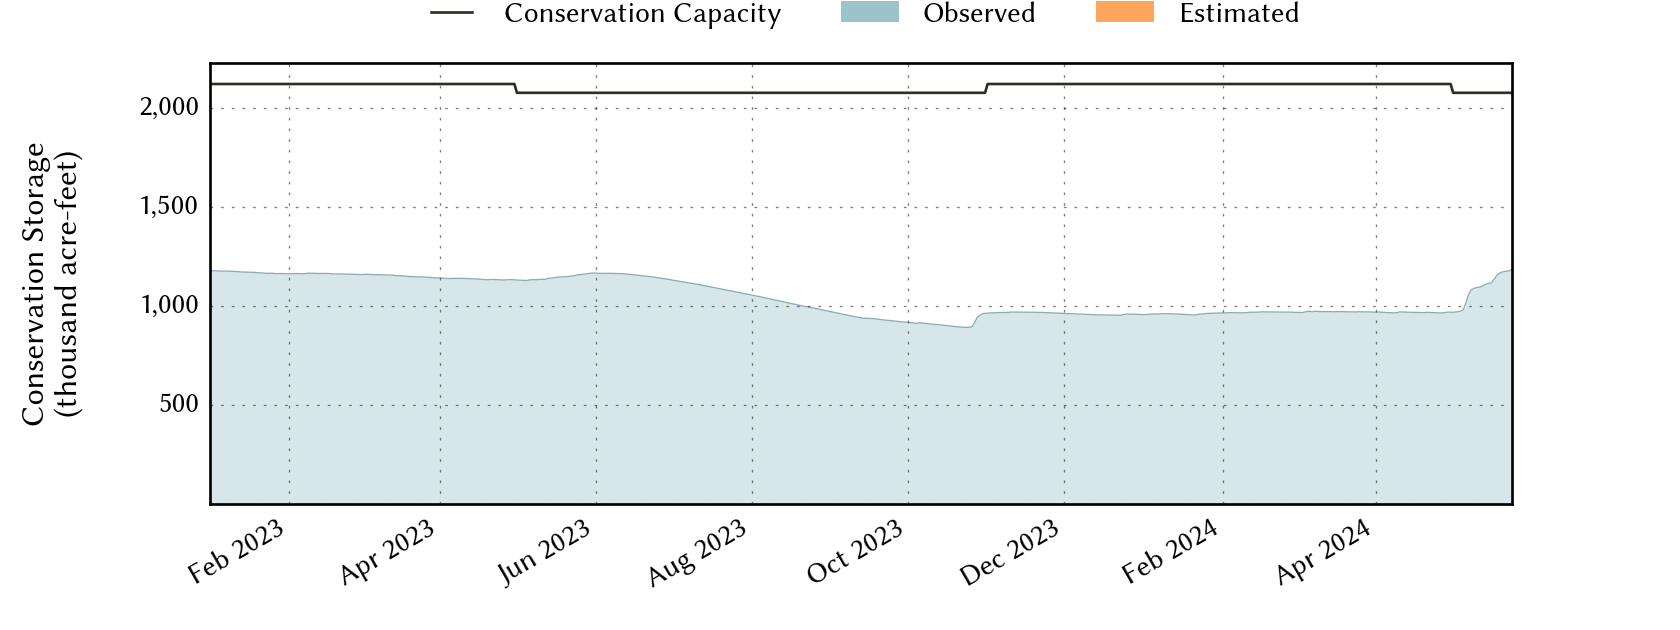
| Today | 2024-05-01 | 46.6 | 1,019,671 | 969,245 | 2,078,327 |
| Yesterday | 2024-04-30 | 45.7 | 1,019,809 | 969,383 | 2,122,814 |
| 2 days ago | 2024-04-29 | 45.7 | 1,020,154 | 969,728 | 2,122,814 |
| 1 week ago | 2024-04-24 | 45.5 | 1,017,293 | 966,867 | 2,122,814 |
| 1 month ago | 2024-04-01 | 45.7 | 1,020,459 | 970,033 | 2,122,814 |
| 3 months ago | 2024-02-01 | 45.5 | 1,016,206 | 965,780 | 2,122,814 |
| 6 months ago | 2023-11-01 | 45.5 | 1,015,276 | 964,850 | 2,122,814 |
| 1 year ago | 2023-05-01 | 54.5 | 1,182,258 | 1,131,832 | 2,078,327 |
*
Percent Full is based on Conservation Storage and Conservation Capacity and doesn't account for storage in flood pool.
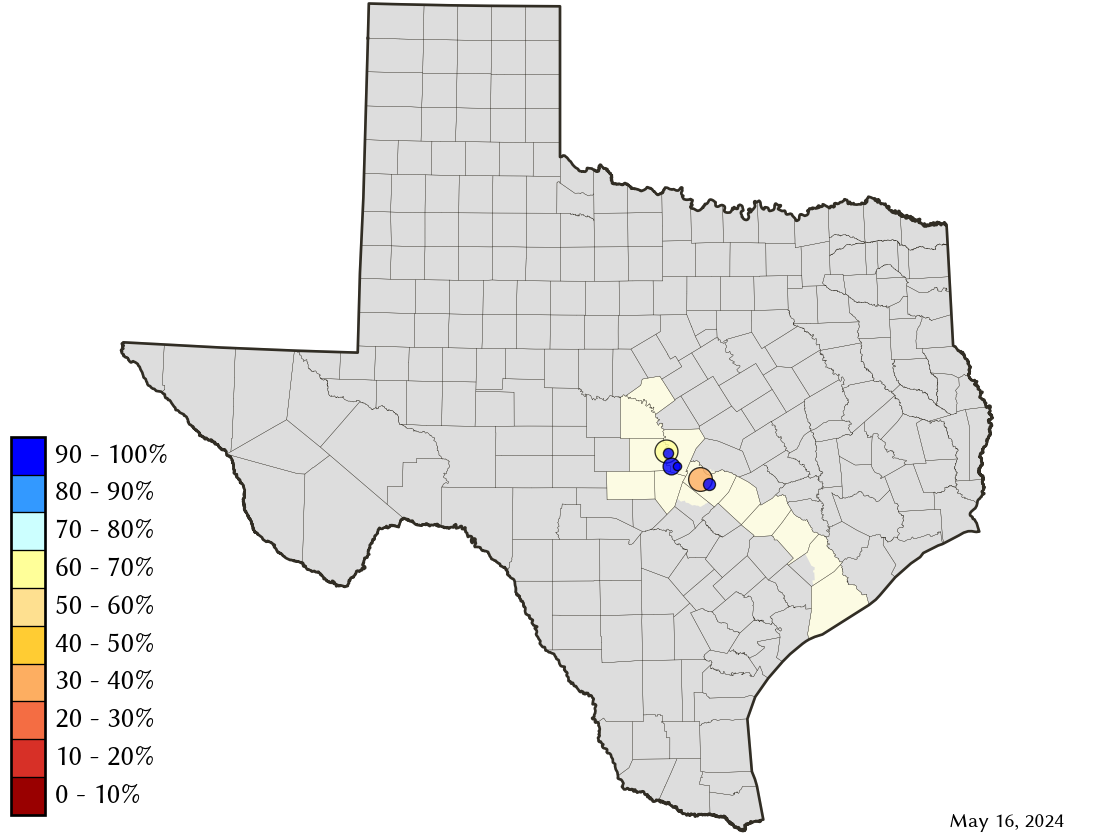
Area Map
Reservoir Storage
| Reservoir | Percent Full |
Water Level (ft) |
Height Above Conservation Pool (ft) |
Reservoir Storage (acre-ft) |
Conservation Storage (acre-ft) |
Conservation Capacity (acre-ft) |
Surface Area (acres) |
|---|---|---|---|---|---|---|---|
| Austin | 95.1 | 492.04 | -0.76 | 23,397 | 22,788 | 23,972 | 1,536 |
| Buchanan | 49.7 | 995.46 | -22.54 | 422,068 | 408,406 | 822,207 | 14,347 |
| Inks | 93.7 | 886.91 | -1.09 | 13,149 | 12,866 | 13,729 | 771 |
| Lyndon B Johnson | 98.3 | 824.70 | -0.30 | 129,693 | 110,853 | 112,778 | 6,404 |
| Marble Falls | 94.7 | 736.34 | -0.66 | 7,197 | 7,197 | 7,597 | 600 |
| Travis | 37.1 | 630.29 | -50.71 | 424,167 | 407,135 | 1,098,044 | 9,218 |