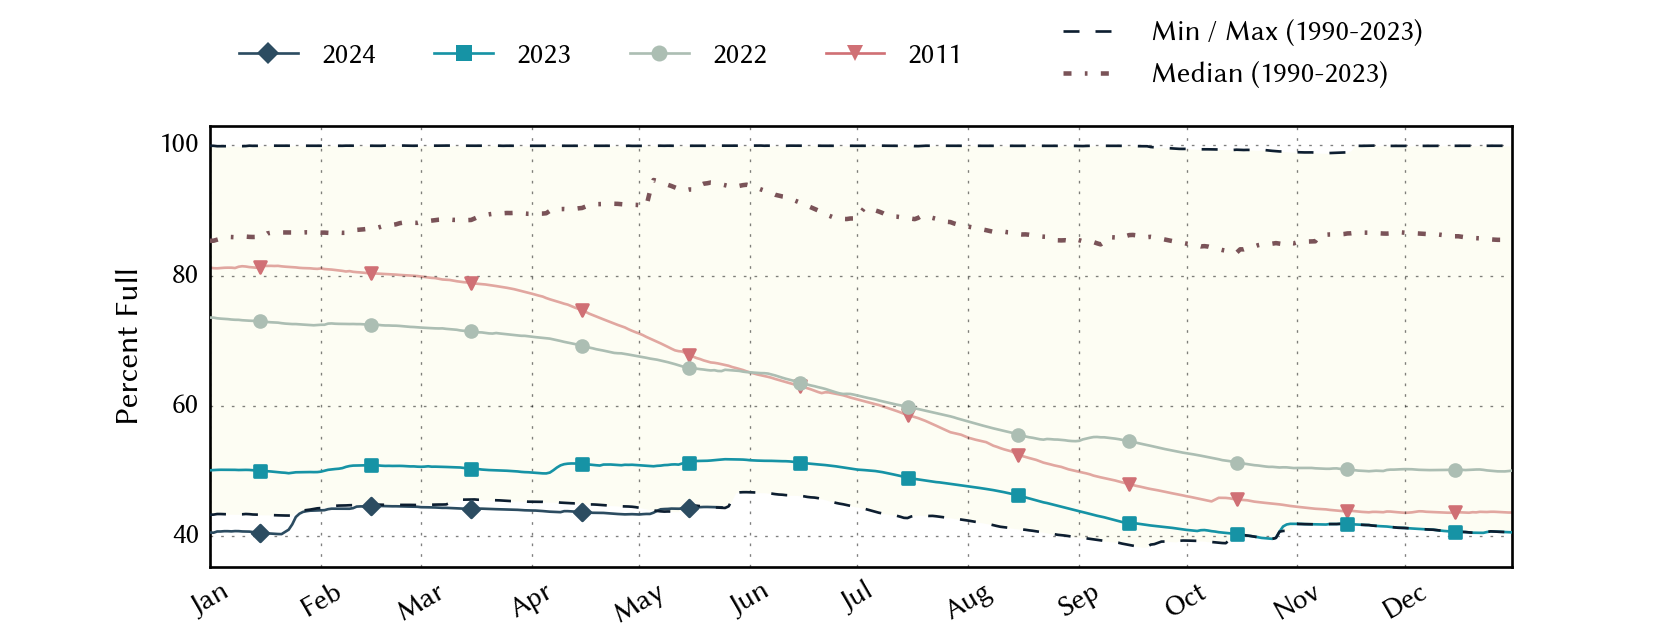
South-Central Climate Division Reservoirs: Monitored Water Supply Reservoirs are 43.3% full on 2024-05-01
Historical Data
| Date | Percent Full |
Reservoir Storage (acre-ft) |
Conservation Storage (acre-ft) |
Conservation Capacity (acre-ft) |
|
|---|---|---|---|---|---|
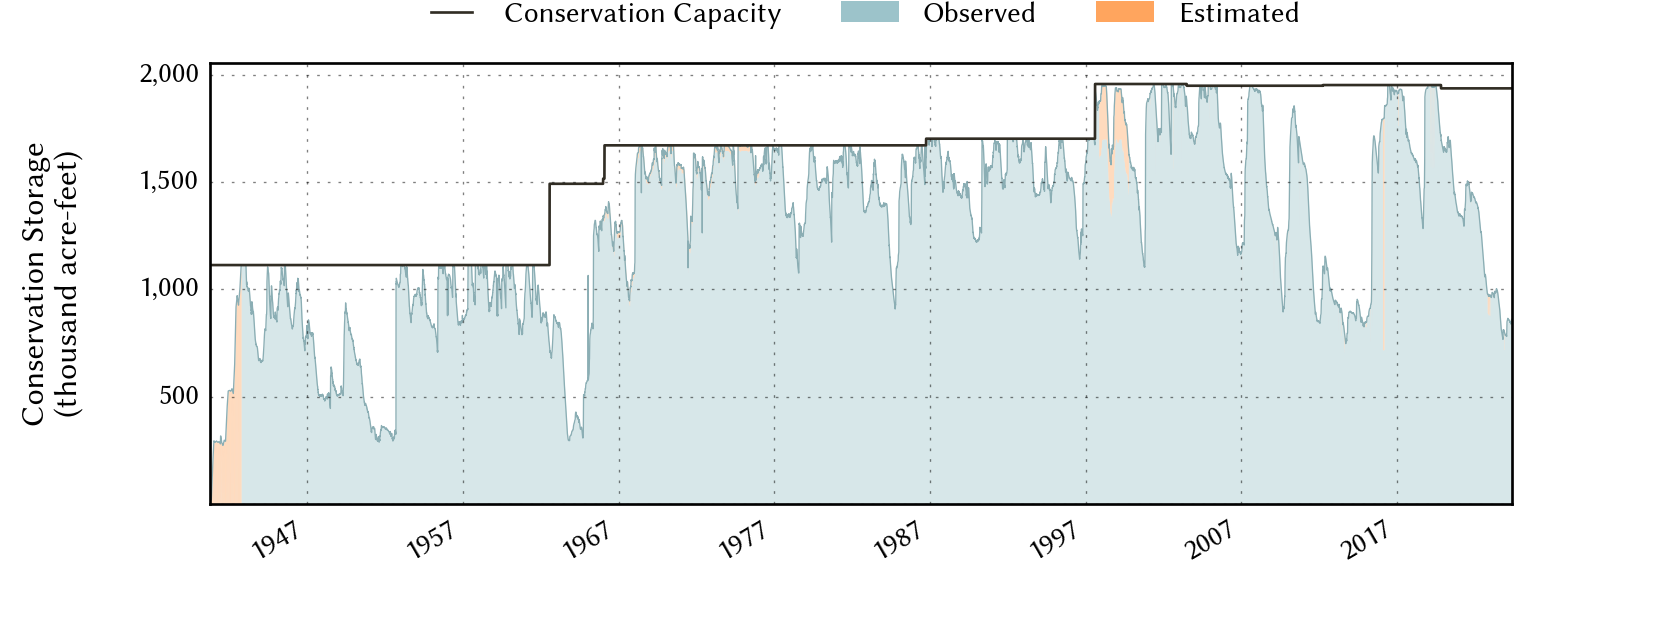
| Today | 2024-05-01 | 43.3 | 866,680 | 839,571 | 1,936,953 |
| Yesterday | 2024-04-30 | 43.4 | 869,213 | 839,997 | 1,936,953 |
| 2 days ago | 2024-04-29 | 43.4 | 872,120 | 840,425 | 1,936,953 |
| 1 week ago | 2024-04-24 | 43.5 | 884,580 | 841,648 | 1,936,953 |
| 1 month ago | 2024-04-01 | 44.0 | 874,123 | 851,318 | 1,936,953 |
| 3 months ago | 2024-02-01 | 44.0 | 870,622 | 851,787 | 1,936,953 |
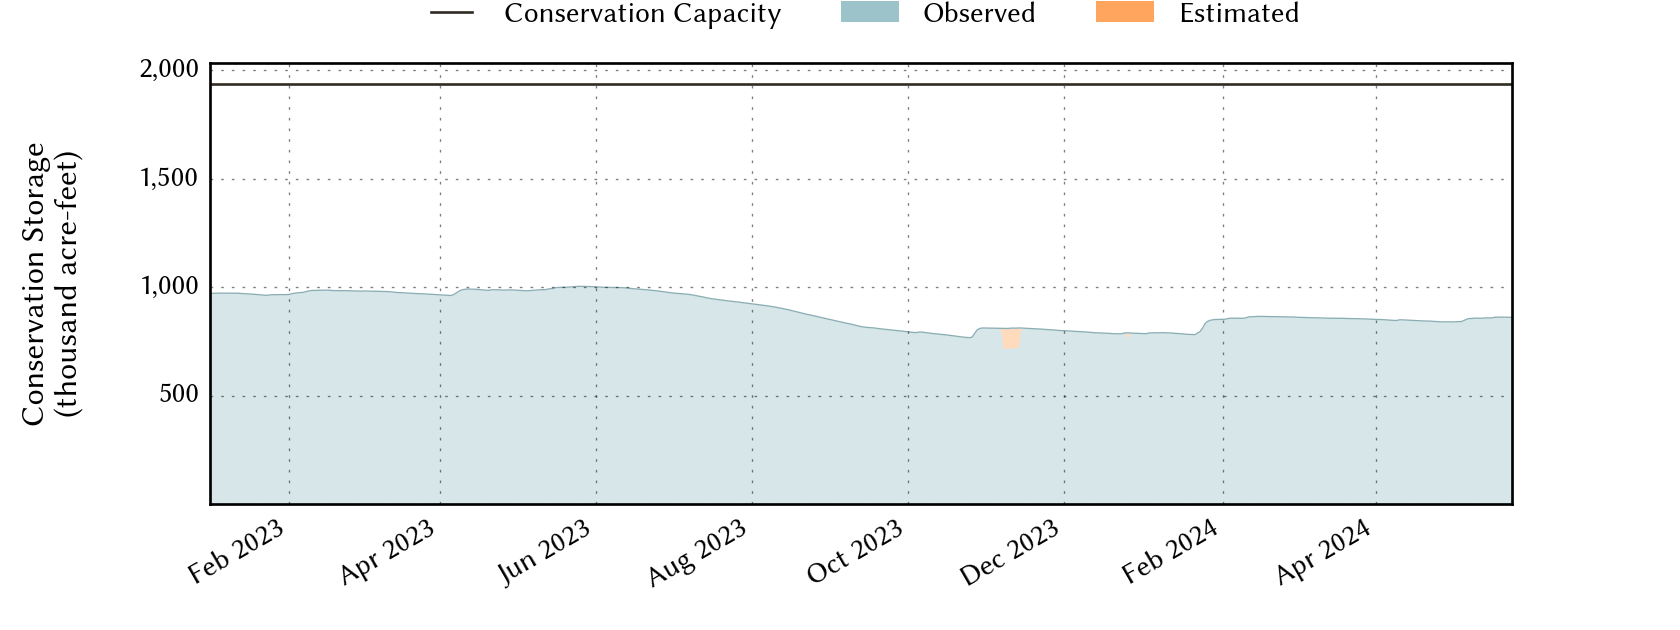
| 6 months ago | 2023-11-01 | 41.9 | 829,182 | 811,470 | 1,936,953 |
| 1 year ago | 2023-05-01 | 50.9 | 1,025,960 | 985,725 | 1,936,953 |
*
Percent Full is based on Conservation Storage and Conservation Capacity and doesn't account for storage in flood pool.
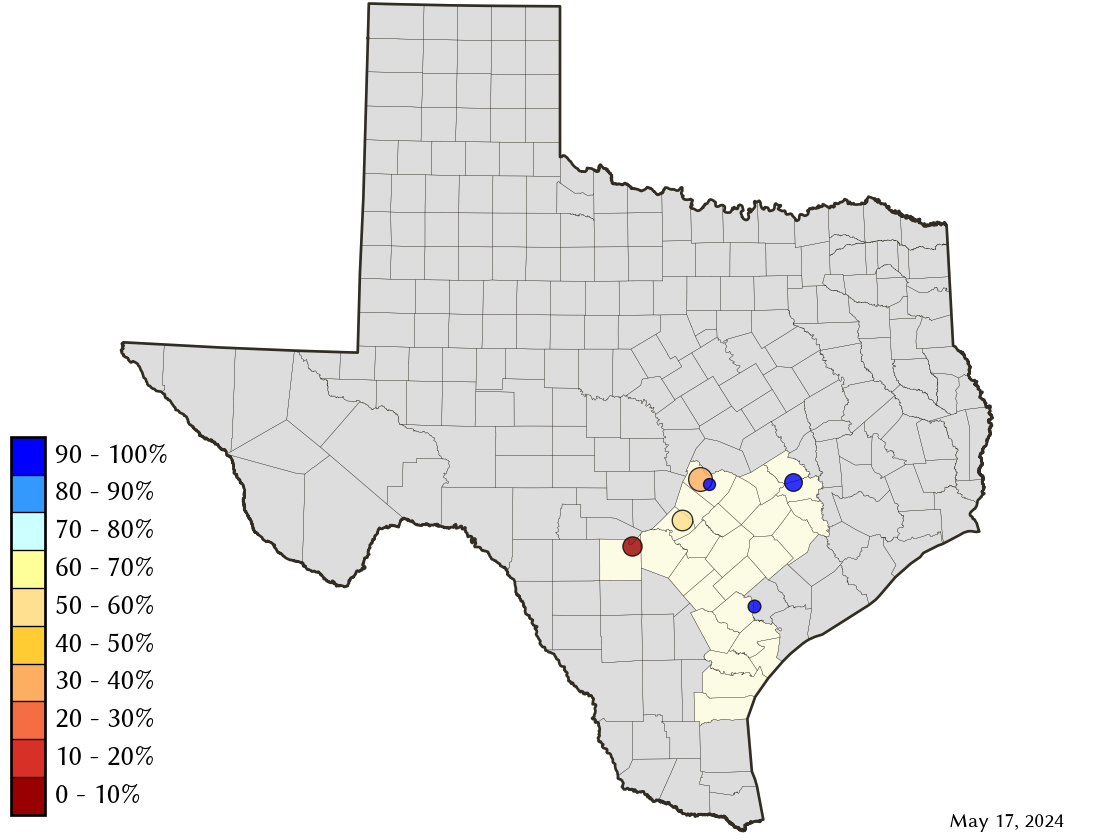
Area Map
Reservoir Storage
| Reservoir | Percent Full |
Water Level (ft) |
Height Above Conservation Pool (ft) |
Reservoir Storage (acre-ft) |
Conservation Storage (acre-ft) |
Conservation Capacity (acre-ft) |
Surface Area (acres) |
|---|---|---|---|---|---|---|---|
| Austin | 95.1 | 492.04 | -0.76 | 23,397 | 22,788 | 23,972 | 1,536 |
| Canyon | 58.7 | 886.58 | -22.42 | 222,434 | 222,363 | 378,781 | 5,805 |
| Coleto Creek | 96.6 | 97.55 | -0.45 | 29,985 | 29,985 | 31,040 | 2,590 |
| Medina | 2.7 | 972.54 | -91.66 | 7,007 | 7,007 | 254,823 | 612 |
| Somerville | 100.0 | 238.82 | 0.82 | 159,690 | 150,293 | 150,293 | - n.a. - |
| Travis | 37.1 | 630.29 | -50.71 | 424,167 | 407,135 | 1,098,044 | 9,218 |