Dallas Area Reservoirs: Monitored Water Supply Reservoirs are 100.0% full on 2024-05-01
Historical Data
| Date | Percent Full |
Reservoir Storage (acre-ft) |
Conservation Storage (acre-ft) |
Conservation Capacity (acre-ft) |
|
|---|---|---|---|---|---|
| Today | 2024-05-01 | 100.0 | 4,210,633 | 3,840,521 | 3,840,521 |
| Yesterday | 2024-04-30 | 100.0 | 4,212,093 | 3,840,521 | 3,840,521 |
| 2 days ago | 2024-04-29 | 100.0 | 4,194,042 | 3,840,521 | 3,840,521 |
| 1 week ago | 2024-04-24 | 100.0 | 4,091,549 | 3,840,521 | 3,840,521 |
| 1 month ago | 2024-04-01 | 99.8 | 3,970,755 | 3,831,196 | 3,840,521 |
| 3 months ago | 2024-02-01 | 98.3 | 3,881,006 | 3,777,119 | 3,840,521 |
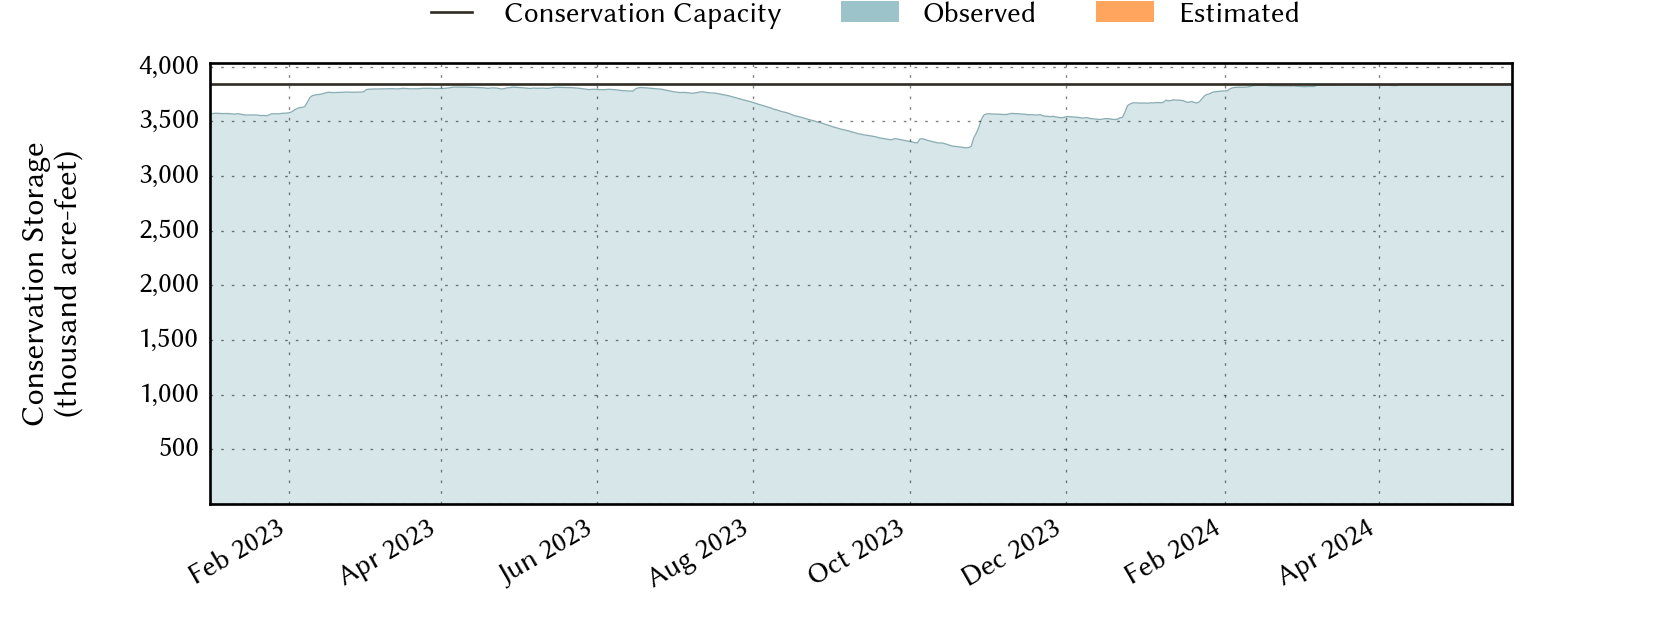
| 6 months ago | 2023-11-01 | 92.9 | 3,638,747 | 3,568,458 | 3,840,521 |
| 1 year ago | 2023-05-01 | 99.2 | 3,890,687 | 3,809,312 | 3,840,521 |
*
Percent Full is based on Conservation Storage and Conservation Capacity and doesn't account for storage in flood pool.
Area Map

Reservoir Storage
| Reservoir | Percent Full |
Water Level (ft) |
Height Above Conservation Pool (ft) |
Reservoir Storage (acre-ft) |
Conservation Storage (acre-ft) |
Conservation Capacity (acre-ft) |
Surface Area (acres) |
|---|---|---|---|---|---|---|---|
| Fork | 100.0 | 403.40 | 0.40 | 647,186 | 605,061 | 605,061 | - n.a. - |
| Grapevine | 100.0 | 538.86 | 3.86 | 190,356 | 163,064 | 163,064 | - n.a. - |
| Lavon | 100.0 | 494.91 | 2.91 | 475,158 | 409,757 | 409,757 | 22,831 |
| Lewisville | 100.0 | 524.54 | 2.54 | 669,755 | 563,228 | 563,228 | - n.a. - |
| Ray Hubbard | 100.0 | 435.53 | 0.03 | 440,189 | 439,559 | 439,559 | 20,985 |
| Ray Roberts | 100.0 | 634.01 | 1.51 | 832,060 | 788,167 | 788,167 | - n.a. - |
| Tawakoni | 100.0 | 439.68 | 2.18 | 954,868 | 871,685 | 871,685 | - n.a. - |