Lavaca Planning Region Reservoirs: Monitored Water Supply Reservoirs are 94.9% full on 2024-05-01
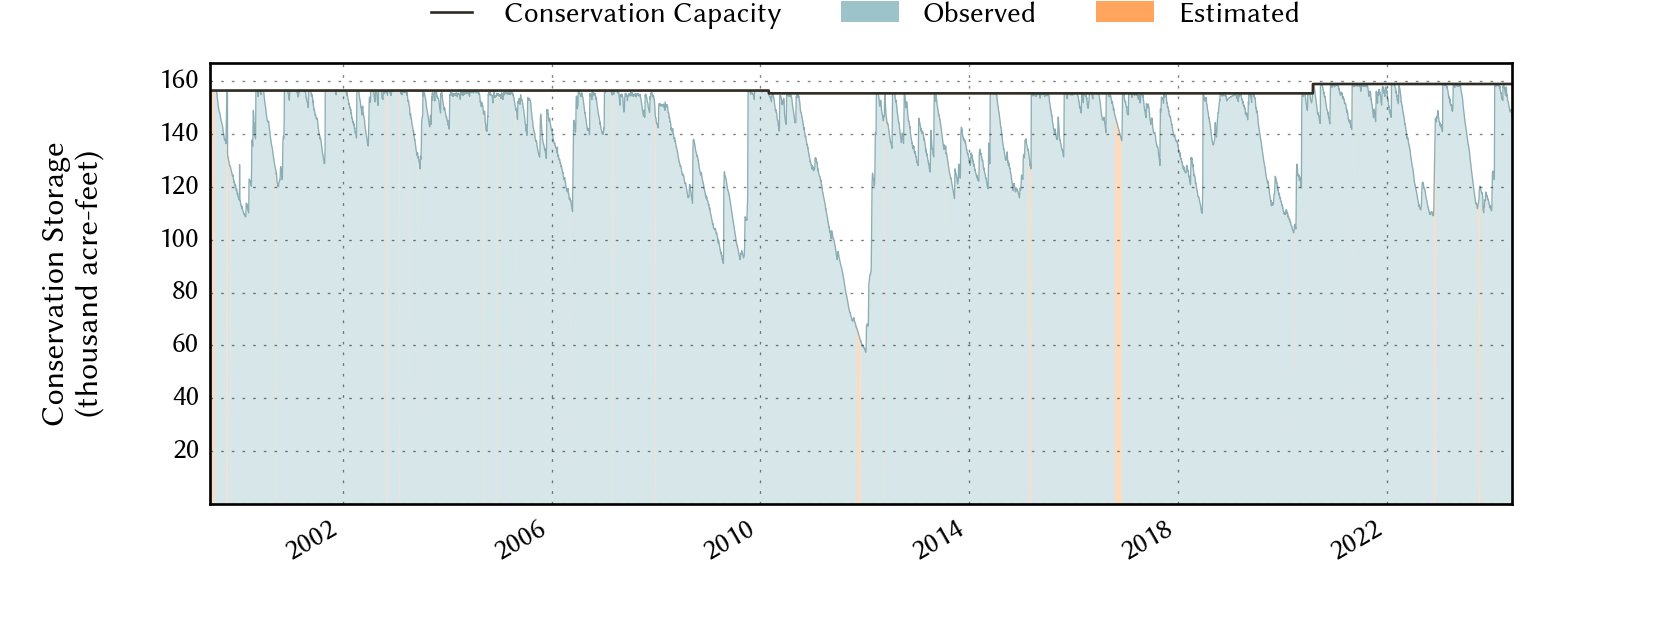
Historical Data
| Date | Percent Full |
Reservoir Storage (acre-ft) |
Conservation Storage (acre-ft) |
Conservation Capacity (acre-ft) |
|
|---|---|---|---|---|---|
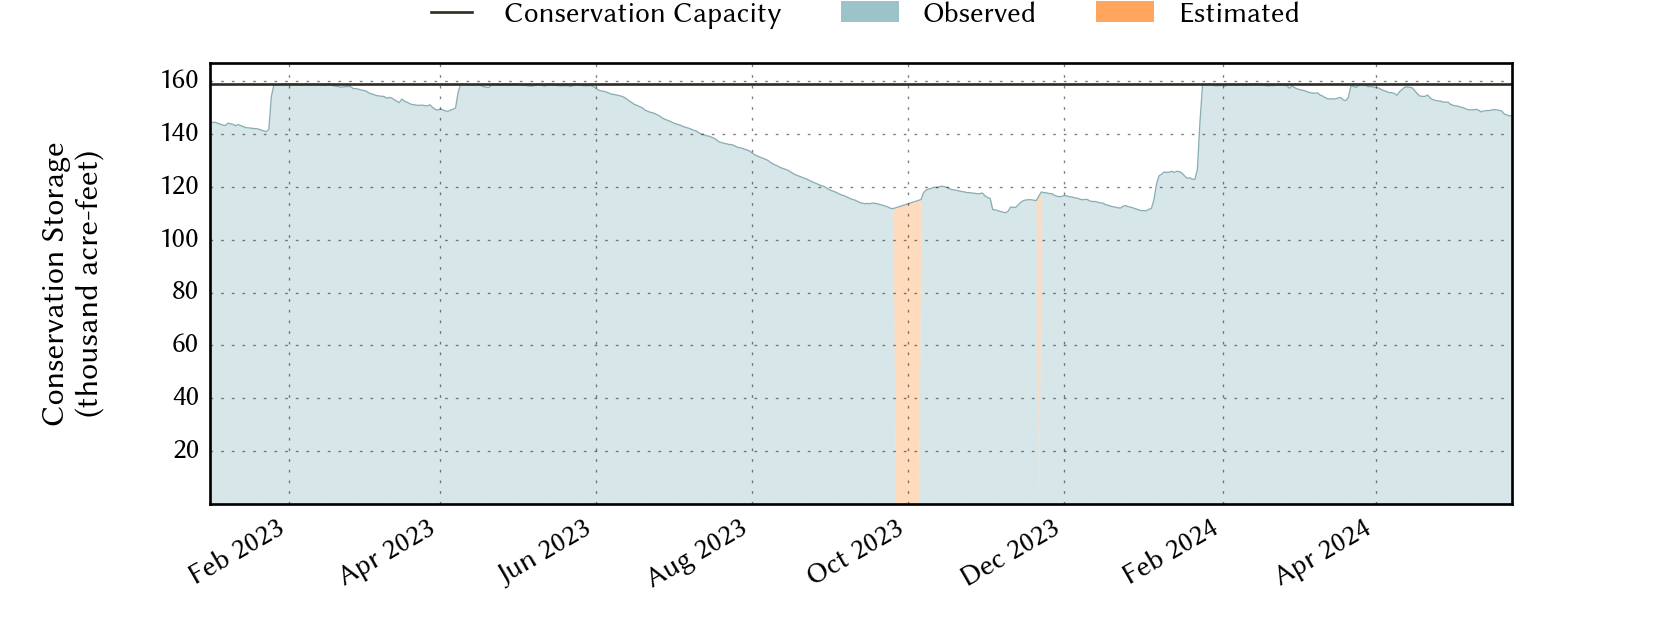
| Most recent | 2024-05-01 | 94.9 | 156,100 | 150,887 | 158,975 |
| 1 day prior | 2024-04-30 | 95.2 | 156,498 | 151,285 | 158,975 |
| 2 days prior | 2024-04-29 | 95.7 | 157,297 | 152,084 | 158,975 |
| 1 week prior | 2024-04-24 | 96.1 | 157,999 | 152,786 | 158,975 |
| 1 month prior | 2024-04-01 | 99.1 | 162,753 | 157,540 | 158,975 |
| 3 months prior | 2024-02-01 | 99.7 | 163,673 | 158,460 | 158,975 |
| 6 months prior | 2023-11-01 | 73.0 | 121,213 | 116,000 | 158,975 |
| 1 year prior | 2023-05-01 | 100.0 | 164,380 | 158,975 | 158,975 |
*
Percent Full is based on Conservation Storage and Conservation Capacity and doesn't account for storage in flood pool.
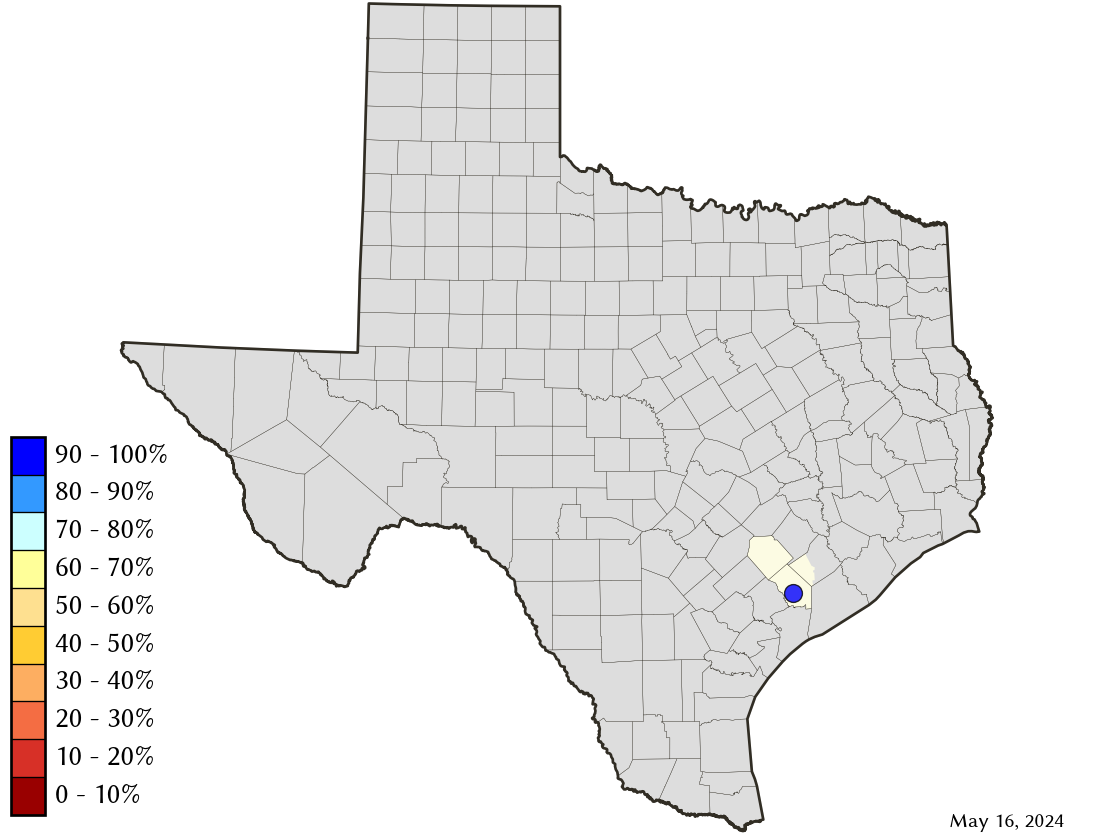
Area Map
Reservoir Storage
| Reservoir | Percent Full |
Water Level (ft) |
Height Above Conservation Pool (ft) |
Reservoir Storage (acre-ft) |
Conservation Storage (acre-ft) |
Conservation Capacity (acre-ft) |
Surface Area (acres) |
|---|---|---|---|---|---|---|---|
| Texana | 94.9 | 43.20 | -0.80 | 156,100 | 150,887 | 158,975 | 9,956 |