Region-C Planning Region Reservoirs: Monitored Water Supply Reservoirs are 97.2% full on 2024-05-01
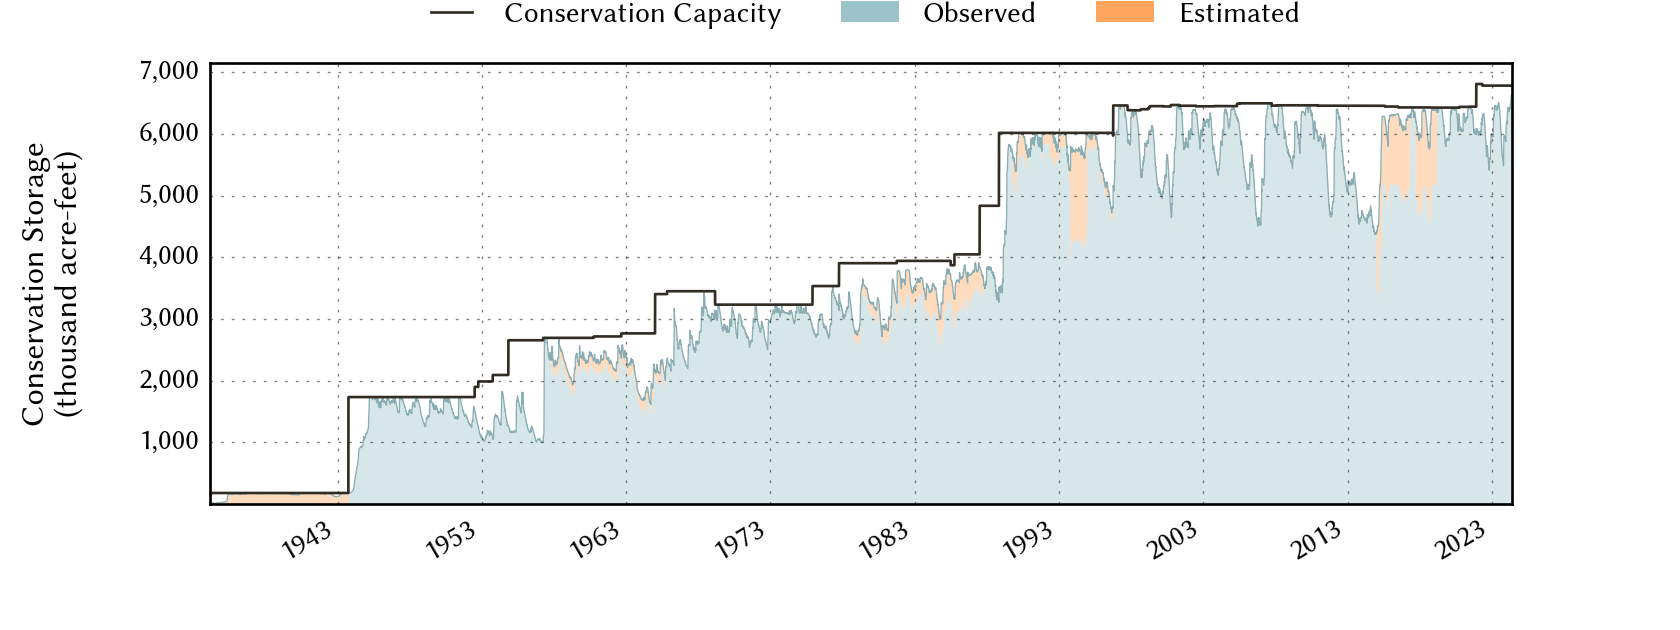
Historical Data
| Date | Percent Full |
Reservoir Storage (acre-ft) |
Conservation Storage (acre-ft) |
Conservation Capacity (acre-ft) |
|
|---|---|---|---|---|---|
| Today | 2024-05-01 | 97.2 | 8,385,643 | 6,595,290 | 6,783,467 |
| Yesterday | 2024-04-30 | 97.2 | 8,313,725 | 6,594,529 | 6,783,467 |
| 2 days ago | 2024-04-29 | 97.1 | 8,228,711 | 6,584,863 | 6,783,467 |
| 1 week ago | 2024-04-24 | 96.0 | 7,962,383 | 6,510,111 | 6,783,467 |
| 1 month ago | 2024-04-01 | 94.6 | 7,742,521 | 6,417,613 | 6,783,467 |
| 3 months ago | 2024-02-01 | 93.7 | 7,694,720 | 6,356,425 | 6,783,467 |
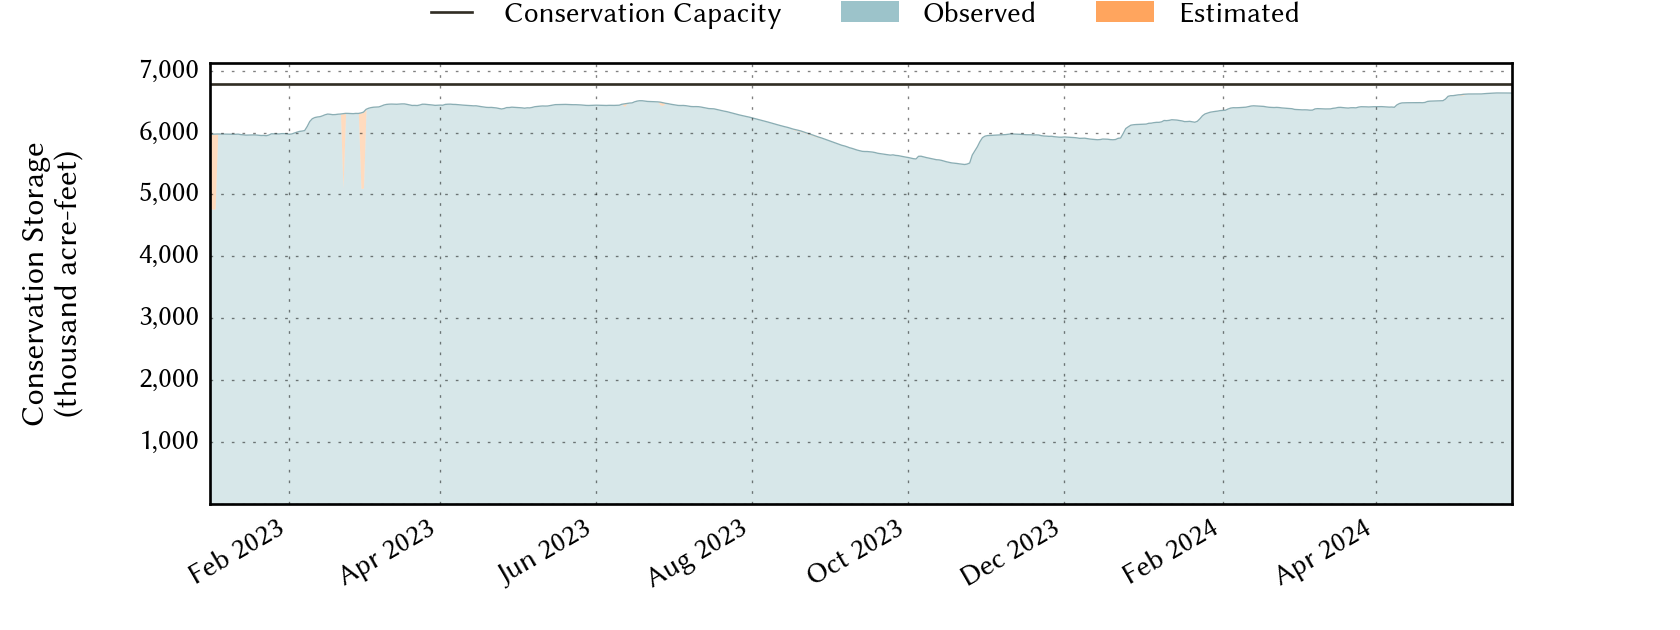
| 6 months ago | 2023-11-01 | 87.7 | 7,195,124 | 5,950,578 | 6,783,467 |
| 1 year ago | 2023-05-01 | 94.4 | 7,664,052 | 6,404,701 | 6,783,467 |
*
Percent Full is based on Conservation Storage and Conservation Capacity and doesn't account for storage in flood pool.
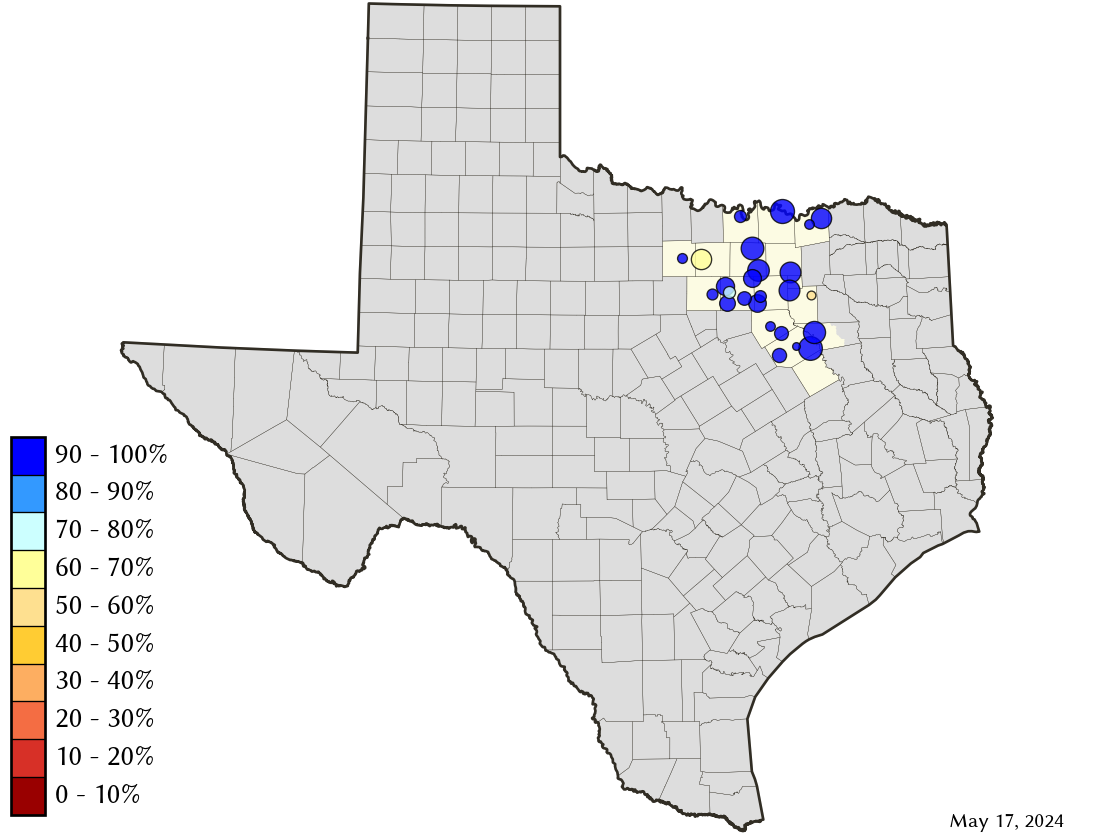
Area Map
Reservoir Storage
| Reservoir | Percent Full |
Water Level (ft) |
Height Above Conservation Pool (ft) |
Reservoir Storage (acre-ft) |
Conservation Storage (acre-ft) |
Conservation Capacity (acre-ft) |
Surface Area (acres) |
|---|---|---|---|---|---|---|---|
| Arlington | 100.0 | 551.24 | 1.24 | 42,593 | 40,157 | 40,157 | - n.a. - |
| Bardwell | 100.0 | 430.14 | 9.14 | 79,632 | 43,856 | 43,856 | 4,553 |
| Benbrook | 100.0 | 697.61 | 3.61 | 99,926 | 85,648 | 85,648 | - n.a. - |
| Bois d'Arc | 100.0 | 534.09 | 0.09 | 369,141 | 367,609 | 367,609 | 16,567 |
| Bonham | 100.0 | 565.60 | 0.60 | 11,690 | 11,027 | 11,027 | 1,101 |
| Bridgeport | 60.2 | 822.17 | -13.83 | 223,973 | 223,973 | 372,183 | 9,187 |
| Cedar Creek | 100.0 | 322.33 | 0.33 | 655,642 | 644,686 | 644,686 | - n.a. - |
| Eagle Mountain | 86.4 | 646.24 | -2.86 | 159,956 | 159,956 | 185,087 | 8,376 |
| Grapevine | 100.0 | 538.86 | 3.86 | 190,356 | 163,064 | 163,064 | - n.a. - |
| Halbert | 88.9 | 366.81 | -1.19 | 5,362 | 5,362 | 6,033 | 550 |
| Hubert H Moss | 100.0 | 715.52 | 0.52 | 24,720 | 24,058 | 24,058 | - n.a. - |
| Joe Pool | 100.0 | 524.33 | 2.33 | 167,182 | 149,629 | 149,629 | 7,200 |
| Lavon | 100.0 | 494.91 | 2.91 | 475,158 | 409,757 | 409,757 | 22,831 |
| Lewisville | 100.0 | 524.54 | 2.54 | 669,755 | 563,228 | 563,228 | - n.a. - |
| Lost Creek | 94.6 | 1,007.96 | -1.54 | 11,308 | 11,308 | 11,950 | - n.a. - |
| Mountain Creek | 100.0 | 457.70 | 0.70 | 24,727 | 22,850 | 22,850 | 2,894 |
| Navarro Mills | 100.0 | 429.81 | 5.31 | 77,585 | 49,827 | 49,827 | - n.a. - |
| New Terrell City | 70.5 | 500.84 | -3.16 | 6,062 | 6,051 | 8,583 | 716 |
| Ray Hubbard | 100.0 | 435.53 | 0.03 | 440,189 | 439,559 | 439,559 | 20,985 |
| Ray Roberts | 100.0 | 634.01 | 1.51 | 832,060 | 788,167 | 788,167 | - n.a. - |
| Richland-Chambers | 100.0 | 315.99 | 0.99 | 1,169,027 | 1,099,417 | 1,099,417 | - n.a. - |
| Texoma 1 | 100.0 | 618.41 | 1.41 | 2,597,139 | 1,243,801 | 1,243,801 | 81,029 |
| Waxahachie | 100.0 | 532.24 | 0.74 | 12,144 | 11,060 | 11,060 | 693 |
| Weatherford | 79.7 | 892.48 | -3.52 | 14,198 | 14,198 | 17,812 | 973 |
| Worth | 69.8 | 591.76 | -2.24 | 26,118 | 17,042 | 24,419 | 3,152 |
footnotes
1
Lake Texoma straddles the border of Texas and Oklahoma, Texas has rights to 50% of Lake Texoma's total conservation capacity. Percent full, conservation storage and conservation capacity are based on the Texas share.