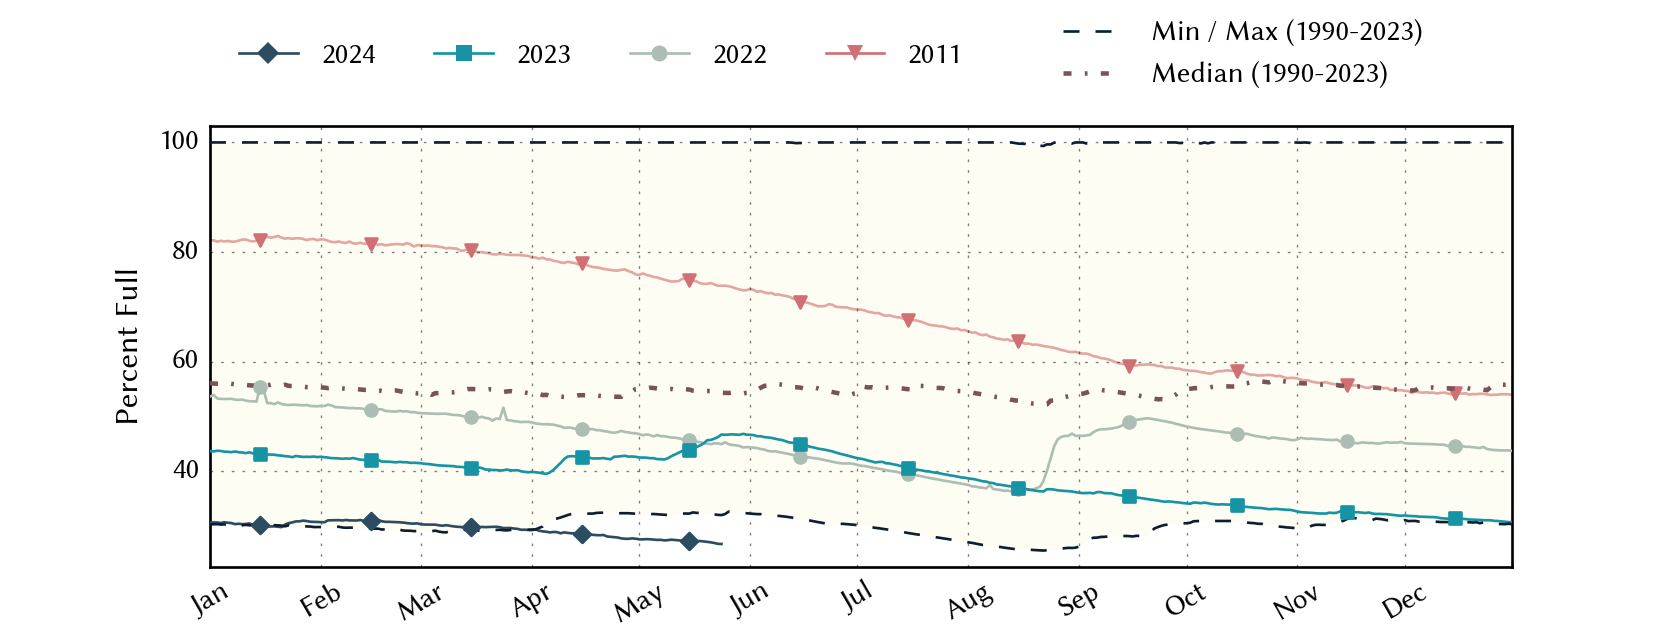
Coastal-Bend Planning Region Reservoirs: Monitored Water Supply Reservoirs are 27.6% full on 2024-05-02
Historical Data
| Date | Percent Full |
Reservoir Storage (acre-ft) |
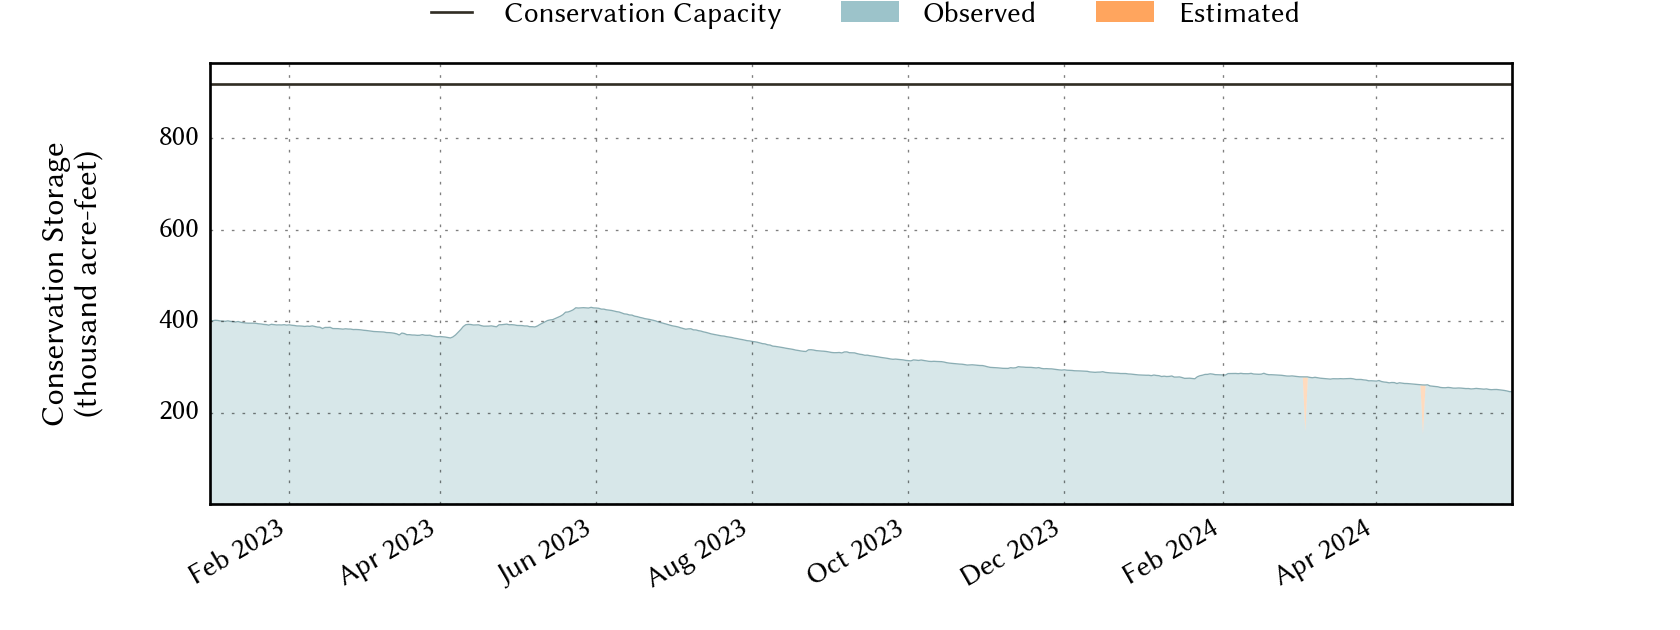
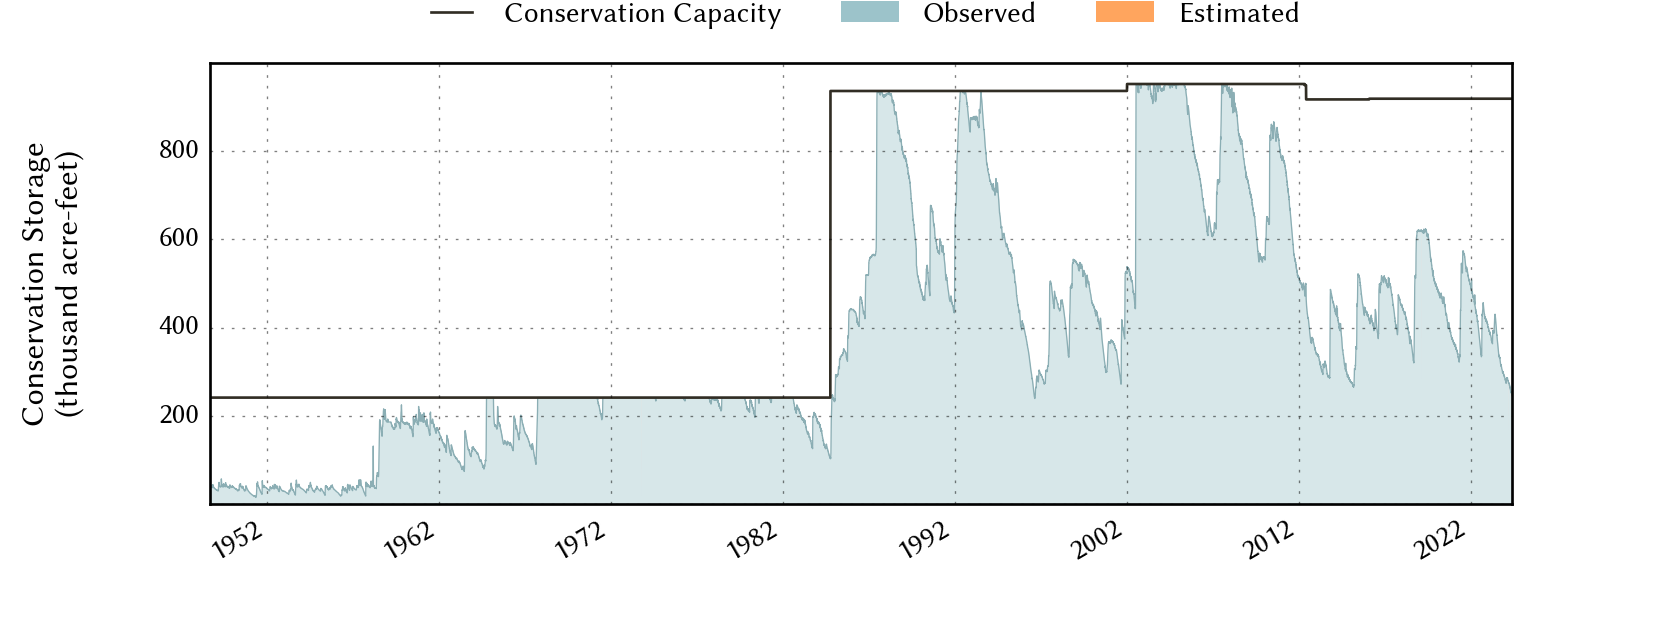
Conservation Storage (acre-ft) |
Conservation Capacity (acre-ft) |
|
|---|---|---|---|---|---|
| Today | 2024-05-02 | 27.6 | 253,444 | 253,165 | 918,882 |
| Yesterday | 2024-05-01 | 27.5 | 253,319 | 253,040 | 918,882 |
| 2 days ago | 2024-04-30 | 27.7 | 254,759 | 254,480 | 918,882 |
| 1 week ago | 2024-04-25 | 27.9 | 256,738 | 256,459 | 918,882 |
| 1 month ago | 2024-04-02 | 29.4 | 270,416 | 270,137 | 918,882 |
| 3 months ago | 2024-02-02 | 30.7 | 282,388 | 282,109 | 918,882 |
| 6 months ago | 2023-11-02 | 32.5 | 299,204 | 298,925 | 918,882 |
| 1 year ago | 2023-05-02 | 42.5 | 390,815 | 390,536 | 918,882 |
*
Percent Full is based on Conservation Storage and Conservation Capacity and doesn't account for storage in flood pool.
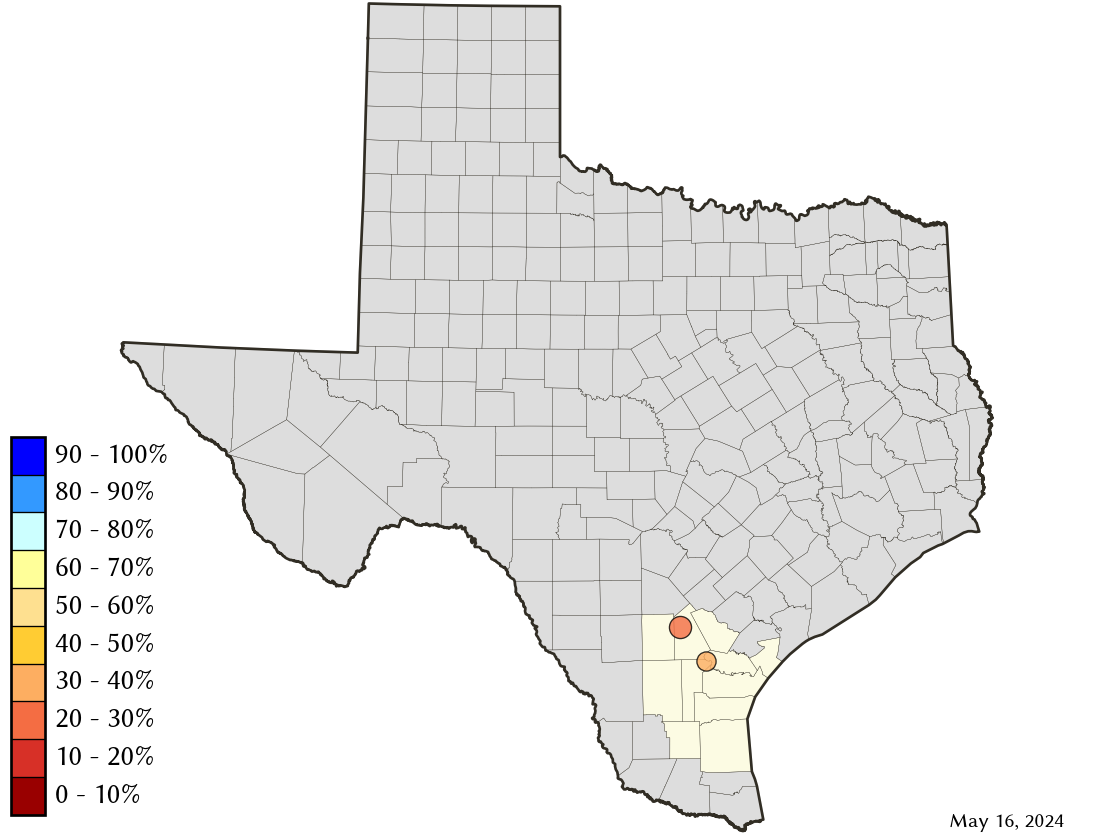
Area Map
Reservoir Storage
| Reservoir | Percent Full |
Water Level (ft) |
Height Above Conservation Pool (ft) |
Reservoir Storage (acre-ft) |
Conservation Storage (acre-ft) |
Conservation Capacity (acre-ft) |
Surface Area (acres) |
|---|---|---|---|---|---|---|---|
| Choke Canyon | 22.8 | 191.61 | -28.89 | 151,445 | 151,444 | 662,820 | 10,568 |
| Corpus Christi | 39.7 | 84.59 | -9.41 | 101,999 | 101,721 | 256,062 | 12,445 |