Fort Worth Area Reservoirs: Monitored Water Supply Reservoirs are 92.6% full on 2024-05-01
Historical Data
| Date | Percent Full |
Reservoir Storage (acre-ft) |
Conservation Storage (acre-ft) |
Conservation Capacity (acre-ft) |
|
|---|---|---|---|---|---|
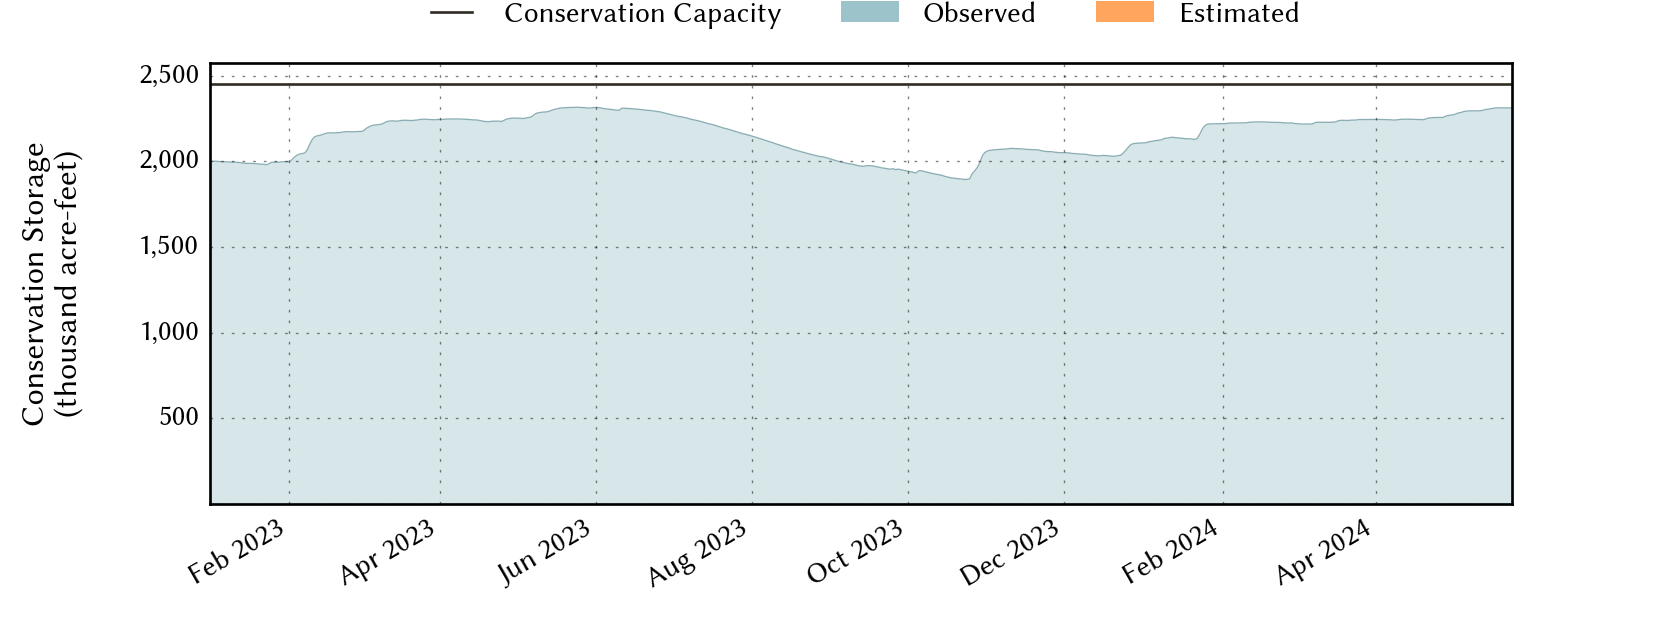
| Most recent | 2024-05-01 | 92.6 | 2,377,235 | 2,270,879 | 2,451,597 |
| 1 day prior | 2024-04-30 | 92.6 | 2,376,406 | 2,270,056 | 2,451,597 |
| 2 days prior | 2024-04-29 | 92.5 | 2,370,246 | 2,267,850 | 2,451,597 |
| 1 week prior | 2024-04-24 | 92.0 | 2,320,576 | 2,255,961 | 2,451,597 |
| 1 month prior | 2024-04-01 | 91.6 | 2,306,385 | 2,244,721 | 2,451,597 |
| 3 months prior | 2024-02-01 | 90.6 | 2,261,122 | 2,220,130 | 2,451,597 |
| 6 months prior | 2023-11-01 | 84.1 | 2,097,834 | 2,061,259 | 2,451,597 |
| 1 year prior | 2023-05-01 | 91.9 | 2,293,758 | 2,252,187 | 2,451,597 |
*
Percent Full is based on Conservation Storage and Conservation Capacity and doesn't account for storage in flood pool.
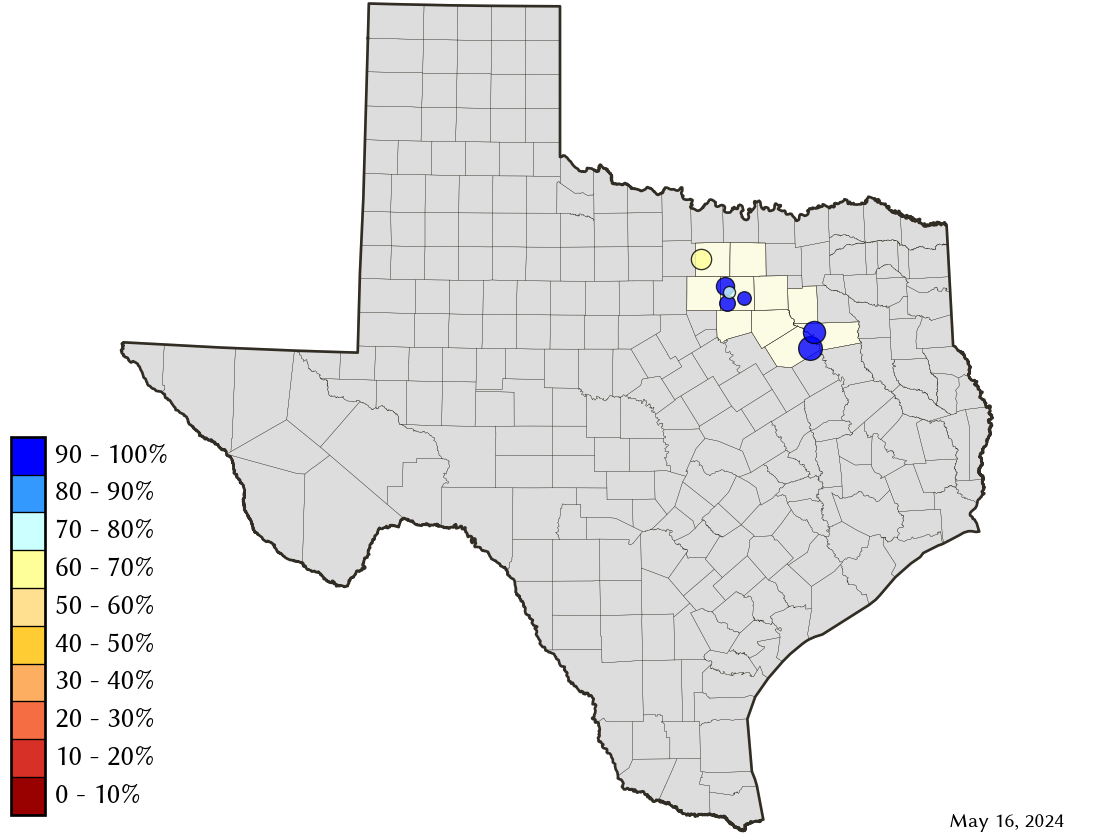
Area Map
Reservoir Storage
| Reservoir | Percent Full |
Water Level (ft) |
Height Above Conservation Pool (ft) |
Reservoir Storage (acre-ft) |
Conservation Storage (acre-ft) |
Conservation Capacity (acre-ft) |
Surface Area (acres) |
|---|---|---|---|---|---|---|---|
| Arlington | 100.0 | 551.19 | 1.19 | 42,495 | 40,157 | 40,157 | - n.a. - |
| Benbrook | 100.0 | 697.66 | 3.66 | 100,137 | 85,648 | 85,648 | - n.a. - |
| Bridgeport | 60.2 | 822.18 | -13.82 | 224,065 | 224,065 | 372,183 | 9,189 |
| Cedar Creek | 100.0 | 322.31 | 0.31 | 654,980 | 644,686 | 644,686 | - n.a. - |
| Eagle Mountain | 86.5 | 646.25 | -2.85 | 160,040 | 160,040 | 185,087 | 8,379 |
| Richland-Chambers | 100.0 | 316.11 | 1.11 | 1,174,393 | 1,099,417 | 1,099,417 | - n.a. - |
| Worth | 69.7 | 591.75 | -2.25 | 26,087 | 17,011 | 24,419 | 3,151 |