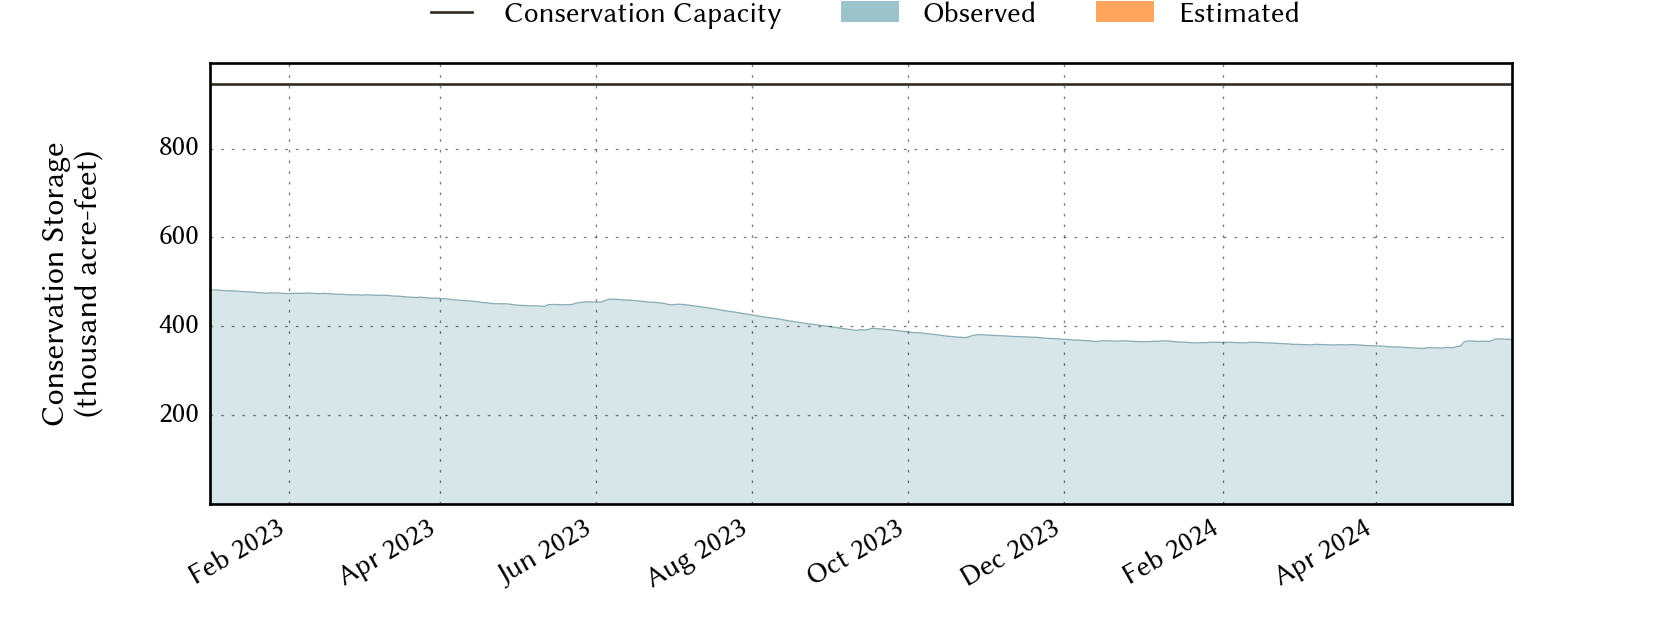
Abilene Area Reservoirs: Monitored Water Supply Reservoirs are 37.2% full on 2024-05-01
Historical Data
| Date | Percent Full |
Reservoir Storage (acre-ft) |
Conservation Storage (acre-ft) |
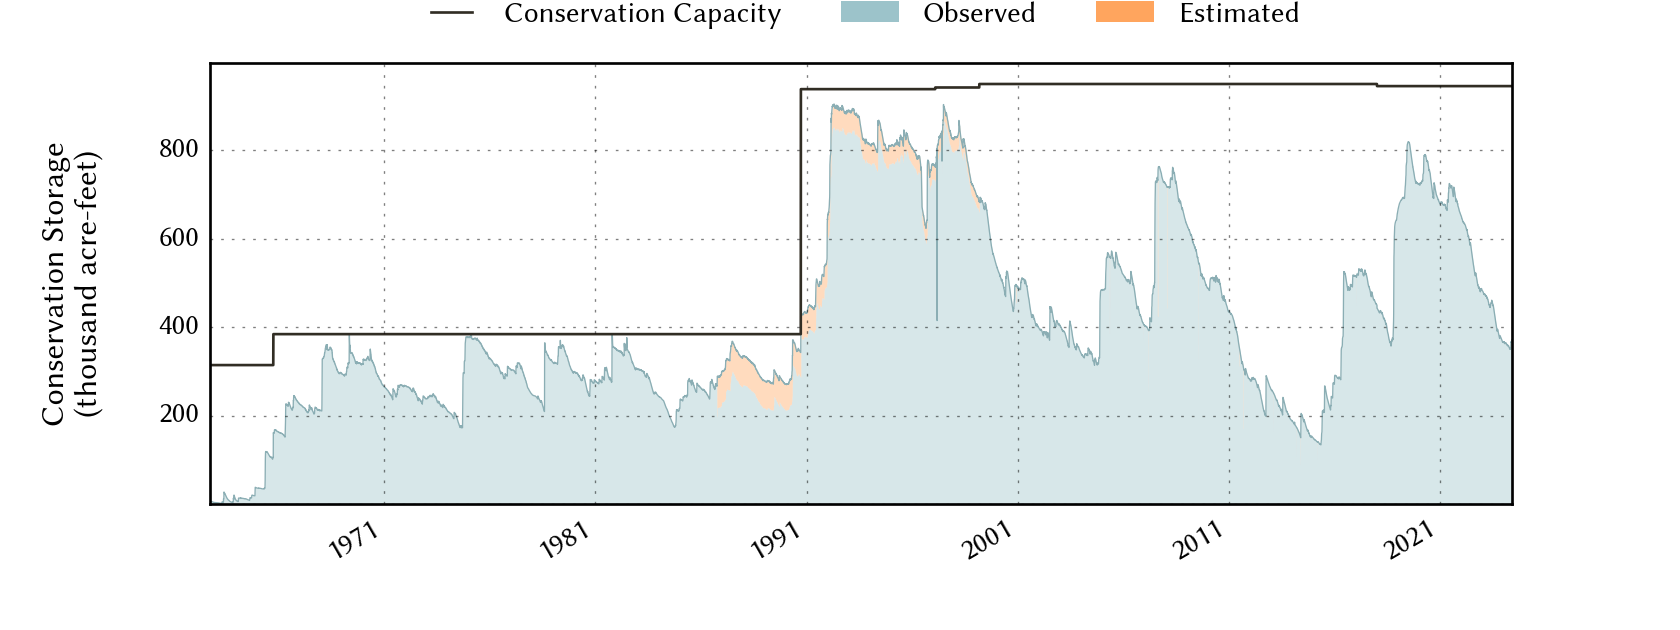
Conservation Capacity (acre-ft) |
|
|---|---|---|---|---|---|
| Today | 2024-05-01 | 37.2 | 356,786 | 351,904 | 945,568 |
| Yesterday | 2024-04-30 | 37.3 | 357,162 | 352,280 | 945,568 |
| 2 days ago | 2024-04-29 | 37.3 | 357,347 | 352,465 | 945,568 |
| 1 week ago | 2024-04-24 | 37.2 | 356,376 | 351,494 | 945,568 |
| 1 month ago | 2024-04-01 | 37.7 | 360,984 | 356,102 | 945,568 |
| 3 months ago | 2024-02-01 | 38.5 | 368,534 | 363,652 | 945,568 |
| 6 months ago | 2023-11-01 | 40.2 | 385,033 | 380,151 | 945,568 |
| 1 year ago | 2023-05-01 | 47.4 | 452,623 | 447,741 | 945,568 |
*
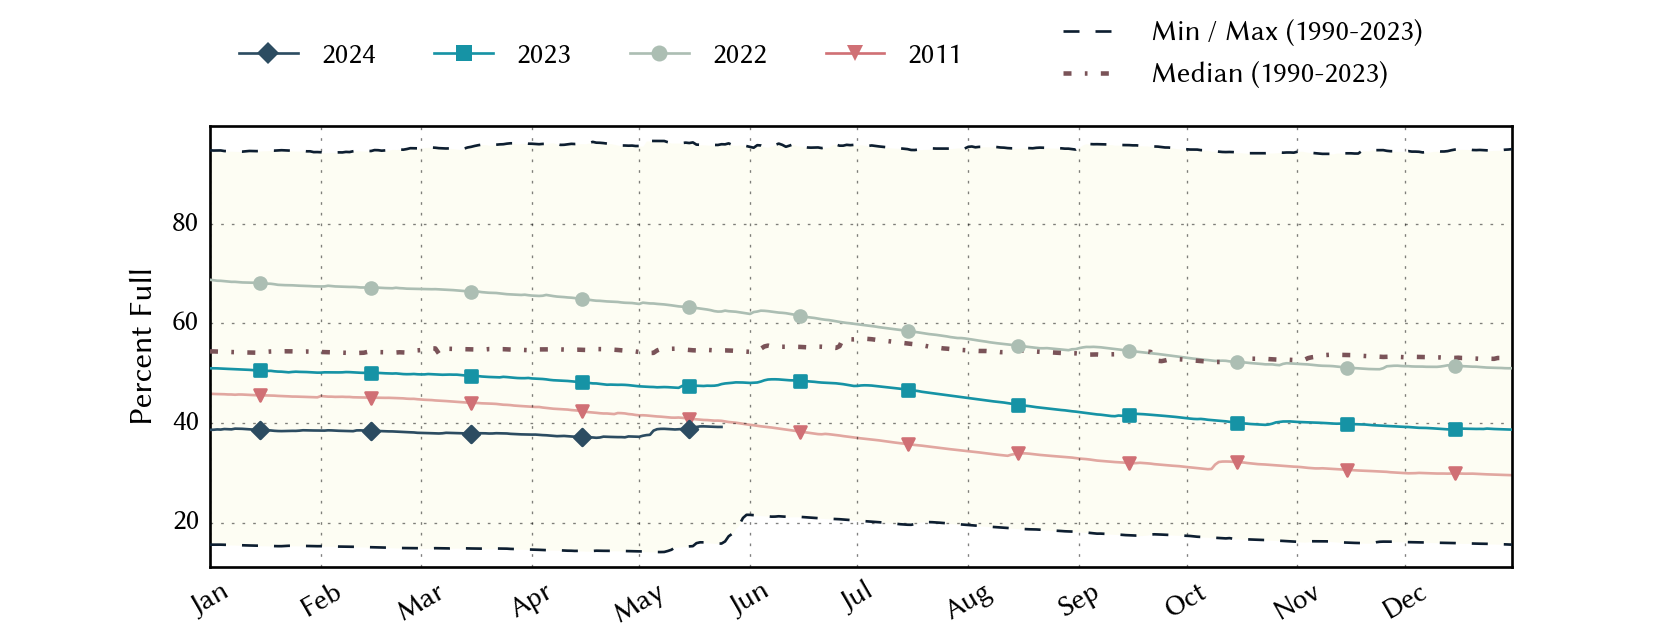
Percent Full is based on Conservation Storage and Conservation Capacity and doesn't account for storage in flood pool.
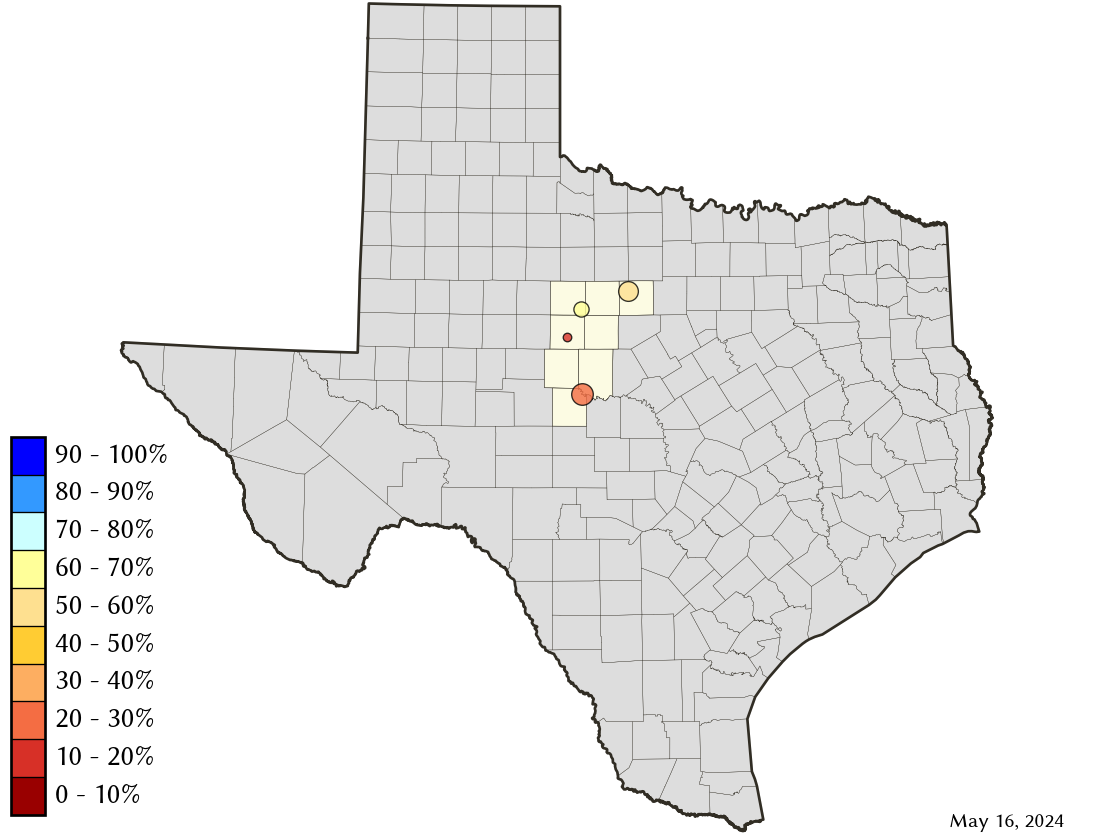
Area Map
Reservoir Storage
| Reservoir | Percent Full |
Water Level (ft) |
Height Above Conservation Pool (ft) |
Reservoir Storage (acre-ft) |
Conservation Storage (acre-ft) |
Conservation Capacity (acre-ft) |
Surface Area (acres) |
|---|---|---|---|---|---|---|---|
| Abilene | 11.4 | 1,993.53 | -18.77 | 902 | 902 | 7,900 | 165 |
| Fort Phantom Hill | 67.5 | 1,629.24 | -6.66 | 47,258 | 47,252 | 70,030 | 2,993 |
| Hubbard Creek | 50.6 | 1,171.19 | -12.12 | 163,494 | 158,618 | 313,298 | 10,042 |
| O H Ivie | 26.2 | 1,519.69 | -31.81 | 145,132 | 145,132 | 554,340 | - n.a. - |