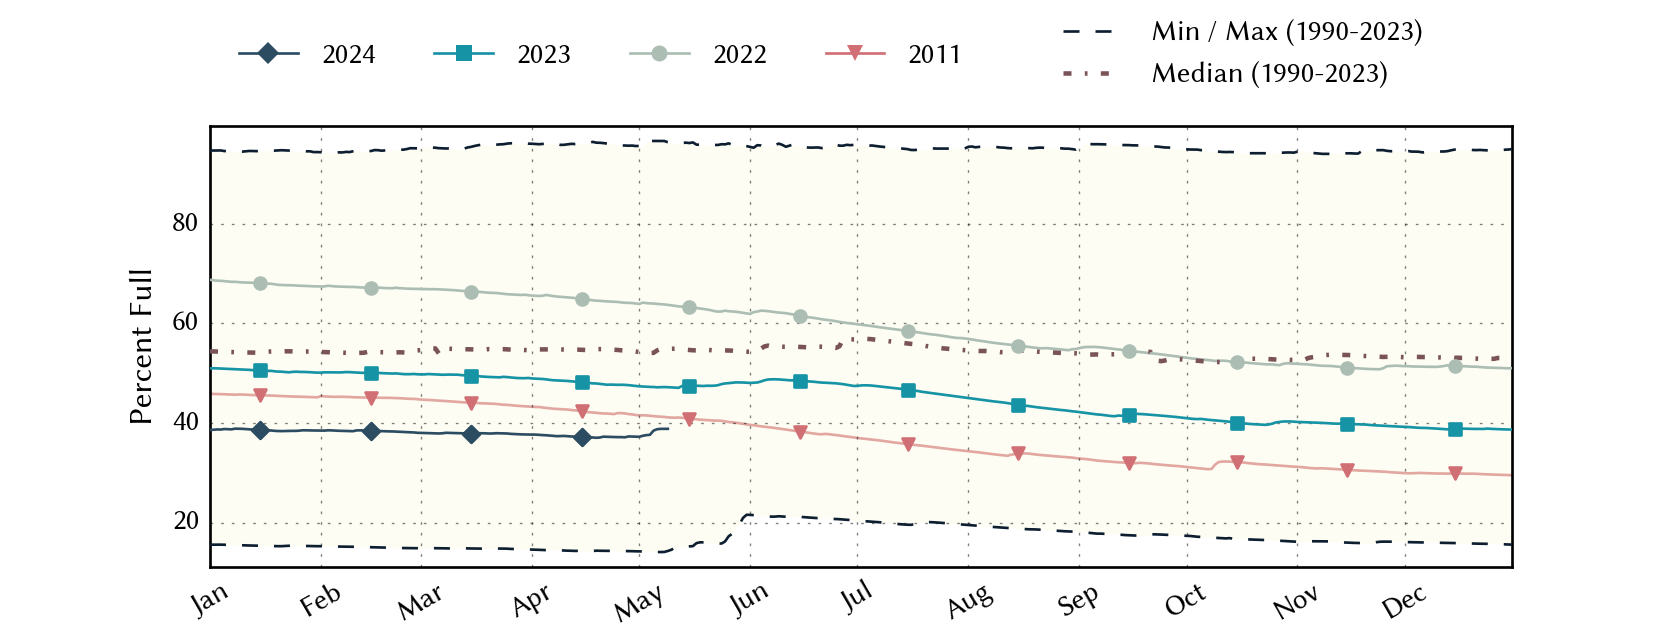
Abilene Area Reservoirs: Monitored Water Supply Reservoirs are 37.1% full on 2024-04-27
Historical Data
| Date | Percent Full |
Reservoir Storage (acre-ft) |
Conservation Storage (acre-ft) |
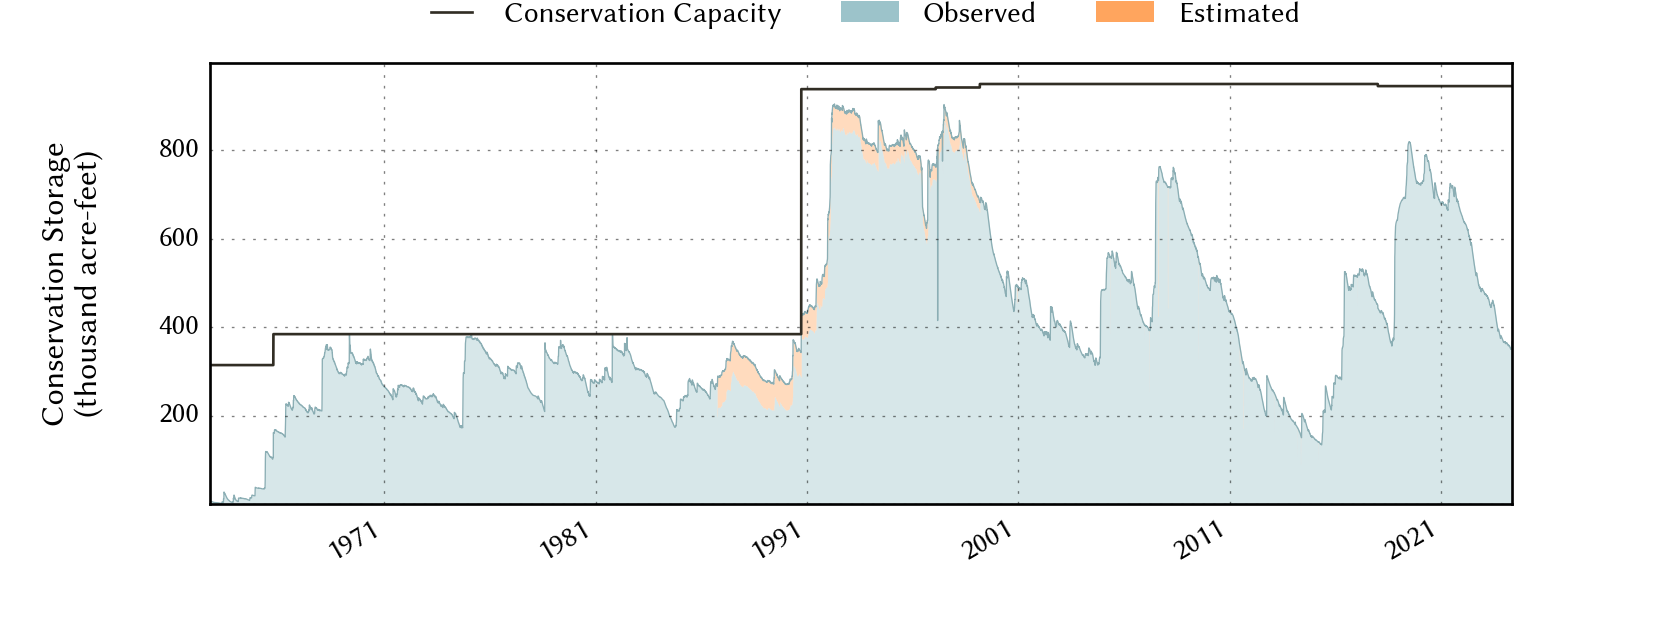
Conservation Capacity (acre-ft) |
|
|---|---|---|---|---|---|
| Today | 2024-04-27 | 37.1 | 355,993 | 351,111 | 945,568 |
| Yesterday | 2024-04-26 | 37.2 | 356,199 | 351,317 | 945,568 |
| 2 days ago | 2024-04-25 | 37.2 | 356,200 | 351,318 | 945,568 |
| 1 week ago | 2024-04-20 | 37.1 | 355,487 | 350,605 | 945,568 |
| 1 month ago | 2024-03-27 | 37.8 | 362,037 | 357,155 | 945,568 |
| 3 months ago | 2024-01-27 | 38.5 | 369,208 | 364,326 | 945,568 |
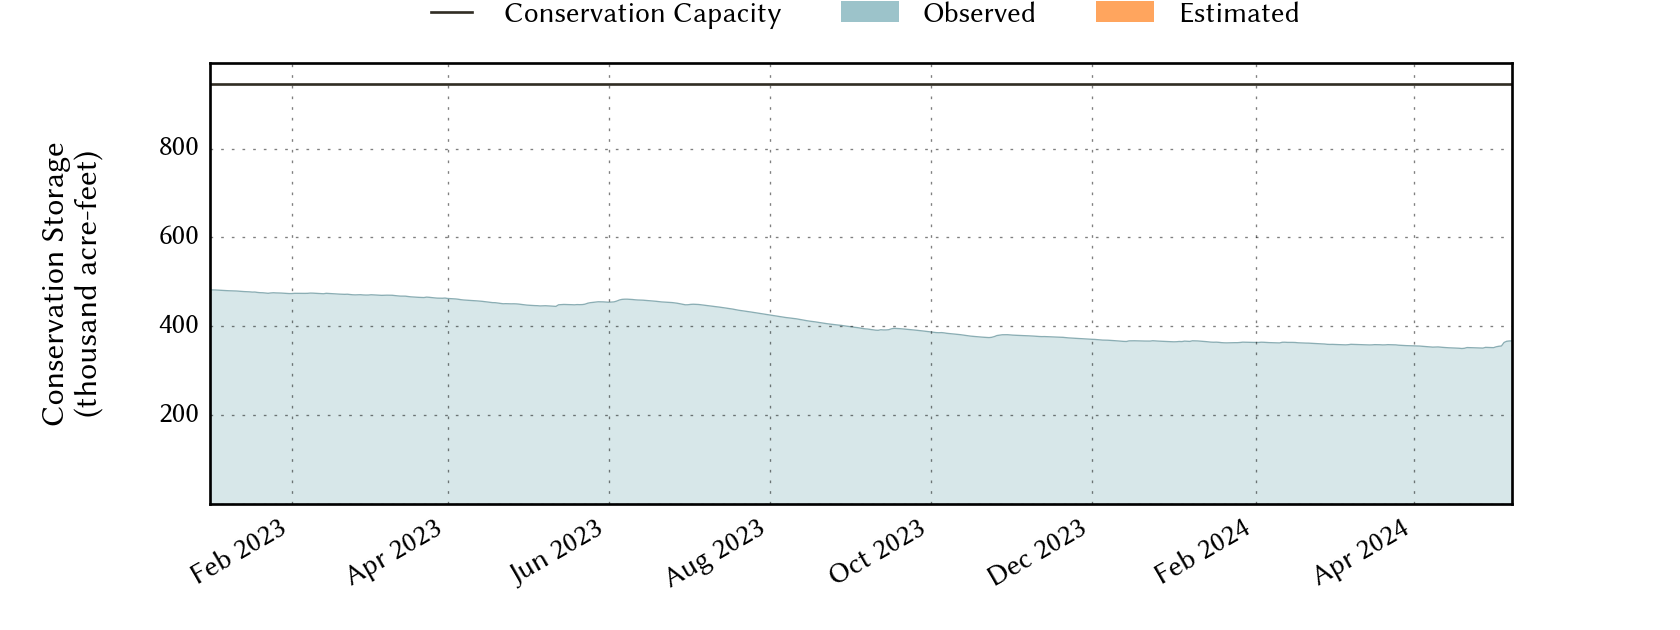
| 6 months ago | 2023-10-27 | 40.2 | 385,041 | 380,159 | 945,568 |
| 1 year ago | 2023-04-27 | 47.6 | 455,381 | 450,499 | 945,568 |
*
Percent Full is based on Conservation Storage and Conservation Capacity and doesn't account for storage in flood pool.
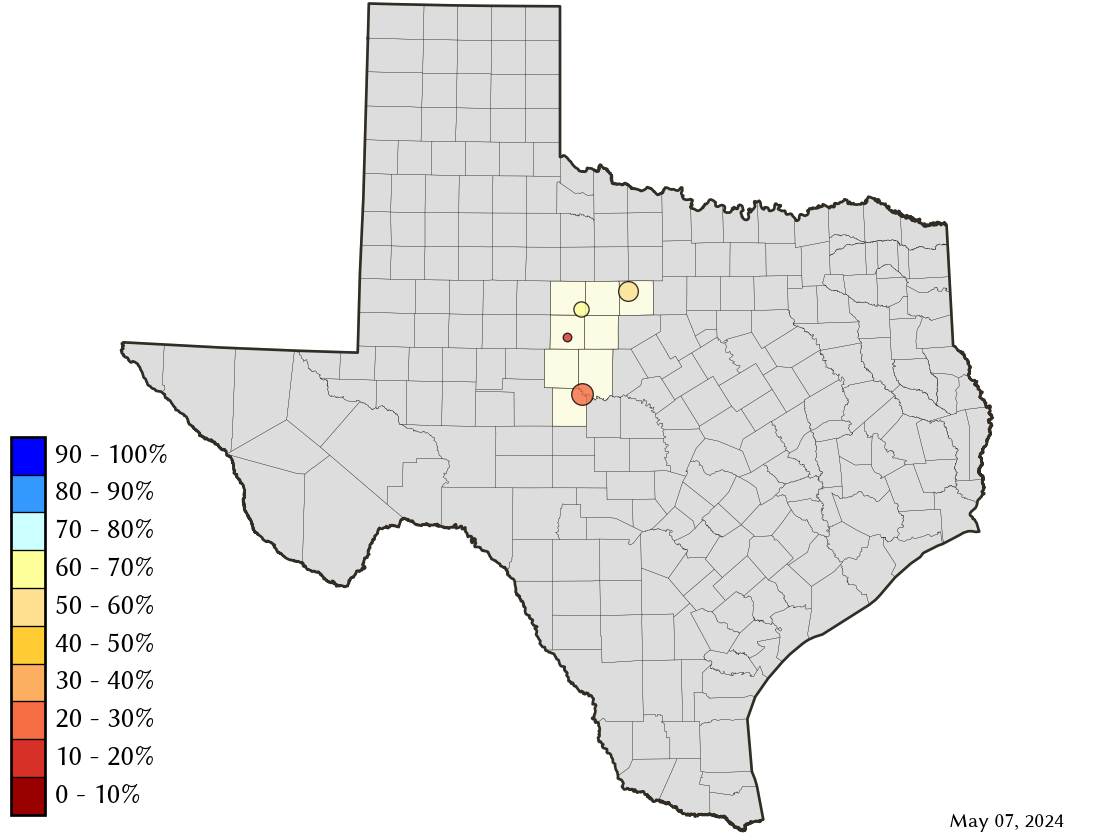
Area Map
Reservoir Storage
| Reservoir | Percent Full |
Water Level (ft) |
Height Above Conservation Pool (ft) |
Reservoir Storage (acre-ft) |
Conservation Storage (acre-ft) |
Conservation Capacity (acre-ft) |
Surface Area (acres) |
|---|---|---|---|---|---|---|---|
| Abilene | 11.6 | 1,993.62 | -18.68 | 916 | 916 | 7,900 | 166 |
| Fort Phantom Hill | 66.6 | 1,629.03 | -6.87 | 46,631 | 46,625 | 70,030 | 2,972 |
| Hubbard Creek | 50.4 | 1,171.13 | -12.18 | 162,893 | 158,017 | 313,298 | 10,018 |
| O H Ivie | 26.3 | 1,519.75 | -31.75 | 145,553 | 145,553 | 554,340 | - n.a. - |