South-Central Climate Division Reservoirs: Monitored Water Supply Reservoirs are 43.4% full on 2024-04-27
Historical Data
| Date | Percent Full |
Reservoir Storage (acre-ft) |
Conservation Storage (acre-ft) |
Conservation Capacity (acre-ft) |
|
|---|---|---|---|---|---|
| Today | 2024-04-27 | 43.4 | 876,877 | 840,039 | 1,936,953 |
| Yesterday | 2024-04-26 | 43.4 | 878,603 | 840,314 | 1,936,953 |
| 2 days ago | 2024-04-25 | 43.4 | 881,541 | 840,939 | 1,936,953 |
| 1 week ago | 2024-04-20 | 43.6 | 868,785 | 844,115 | 1,936,953 |
| 1 month ago | 2024-03-27 | 44.1 | 877,009 | 853,823 | 1,936,953 |
| 3 months ago | 2024-01-27 | 43.7 | 865,973 | 847,167 | 1,936,953 |
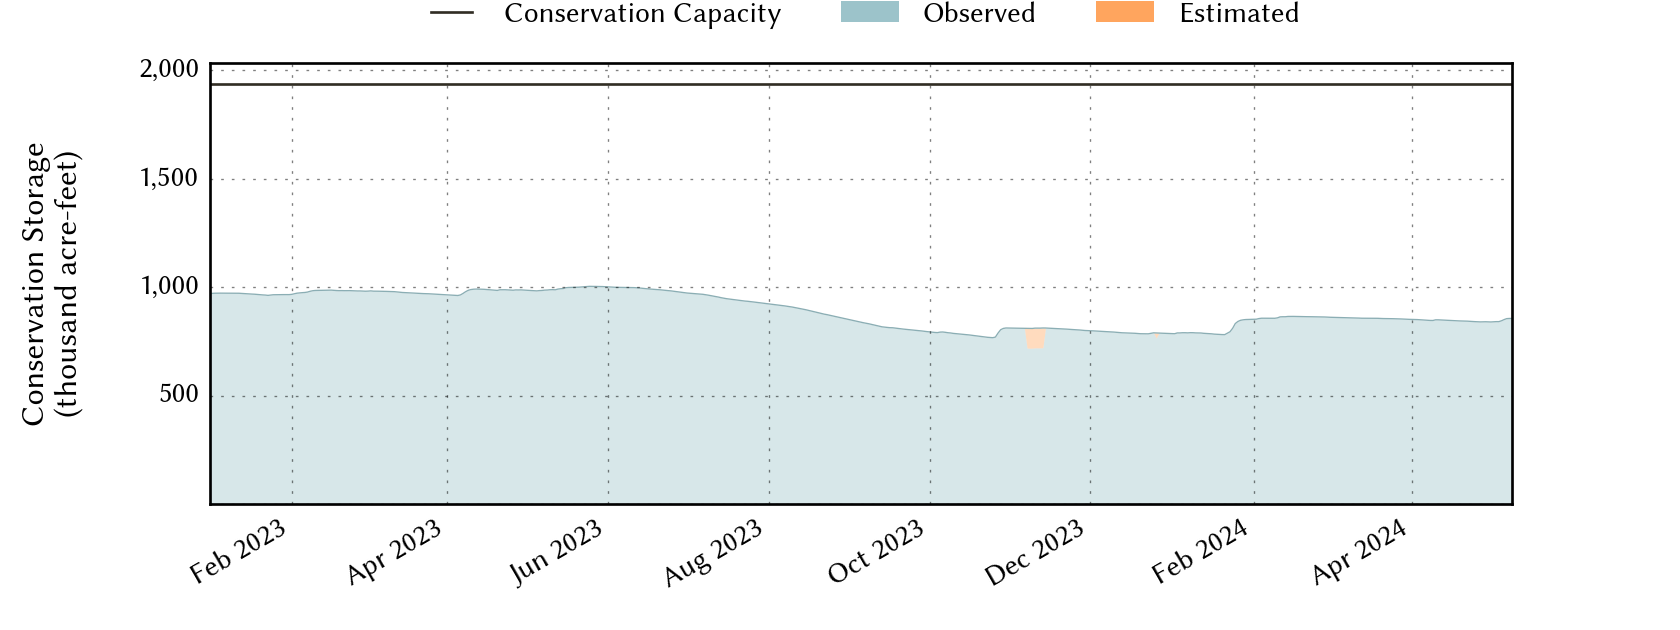
| 6 months ago | 2023-10-27 | 40.7 | 806,122 | 788,410 | 1,936,953 |
| 1 year ago | 2023-04-27 | 51.0 | 1,016,059 | 987,312 | 1,936,953 |
*
Percent Full is based on Conservation Storage and Conservation Capacity and doesn't account for storage in flood pool.
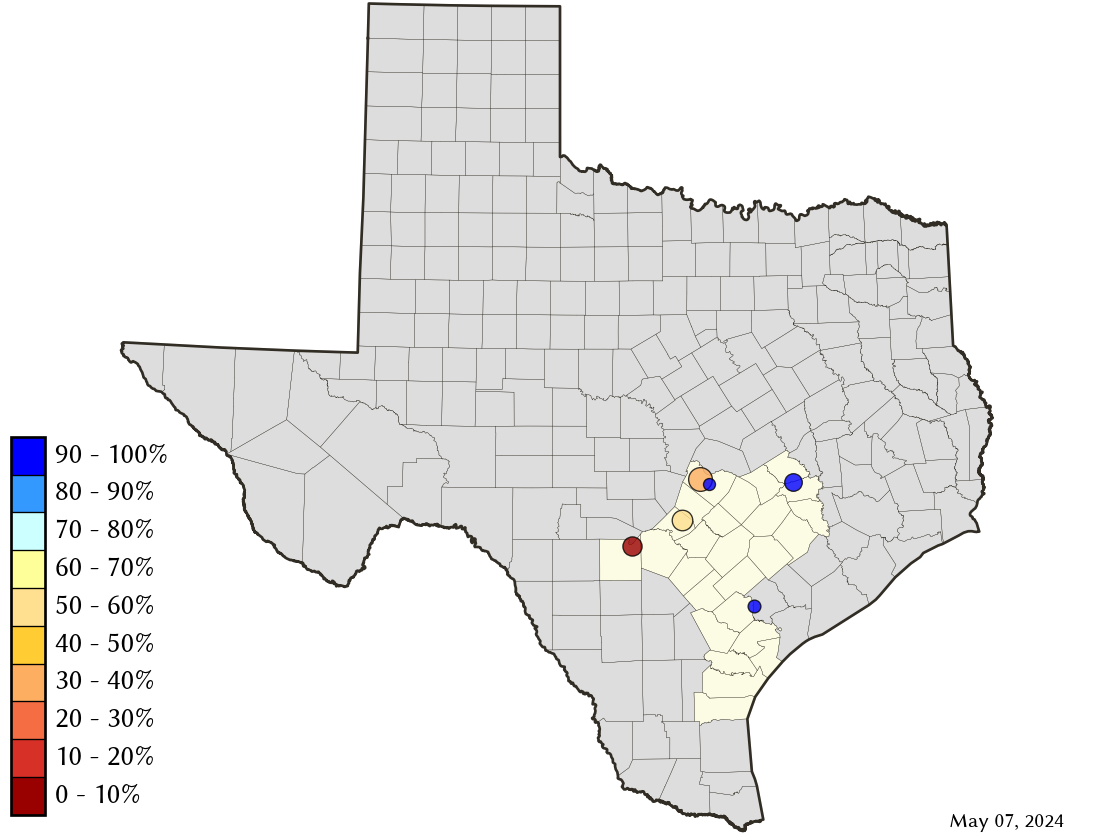
Area Map
Reservoir Storage
| Reservoir | Percent Full |
Water Level (ft) |
Height Above Conservation Pool (ft) |
Reservoir Storage (acre-ft) |
Conservation Storage (acre-ft) |
Conservation Capacity (acre-ft) |
Surface Area (acres) |
|---|---|---|---|---|---|---|---|
| Austin | 96.1 | 492.20 | -0.60 | 23,643 | 23,034 | 23,972 | 1,545 |
| Canyon | 58.8 | 886.61 | -22.39 | 222,608 | 222,537 | 378,781 | 5,808 |
| Coleto Creek | 97.1 | 97.61 | -0.39 | 30,125 | 30,125 | 31,040 | 2,598 |
| Medina | 2.7 | 972.54 | -91.66 | 7,007 | 7,007 | 254,823 | 612 |
| Somerville | 100.0 | 239.64 | 1.64 | 169,419 | 150,293 | 150,293 | - n.a. - |
| Travis | 37.1 | 630.28 | -50.72 | 424,075 | 407,043 | 1,098,044 | 9,217 |