Fort Worth Area Reservoirs: Monitored Water Supply Reservoirs are 92.0% full on 2024-04-27
Historical Data
| Date | Percent Full |
Reservoir Storage (acre-ft) |
Conservation Storage (acre-ft) |
Conservation Capacity (acre-ft) |
|
|---|---|---|---|---|---|
| Today | 2024-04-27 | 92.0 | 2,308,269 | 2,256,091 | 2,451,597 |
| Yesterday | 2024-04-26 | 92.0 | 2,305,051 | 2,256,091 | 2,451,597 |
| 2 days ago | 2024-04-25 | 92.0 | 2,308,278 | 2,256,031 | 2,451,597 |
| 1 week ago | 2024-04-20 | 91.6 | 2,291,019 | 2,245,619 | 2,451,597 |
| 1 month ago | 2024-03-27 | 91.5 | 2,328,325 | 2,244,070 | 2,451,597 |
| 3 months ago | 2024-01-27 | 90.5 | 2,267,265 | 2,218,665 | 2,451,597 |
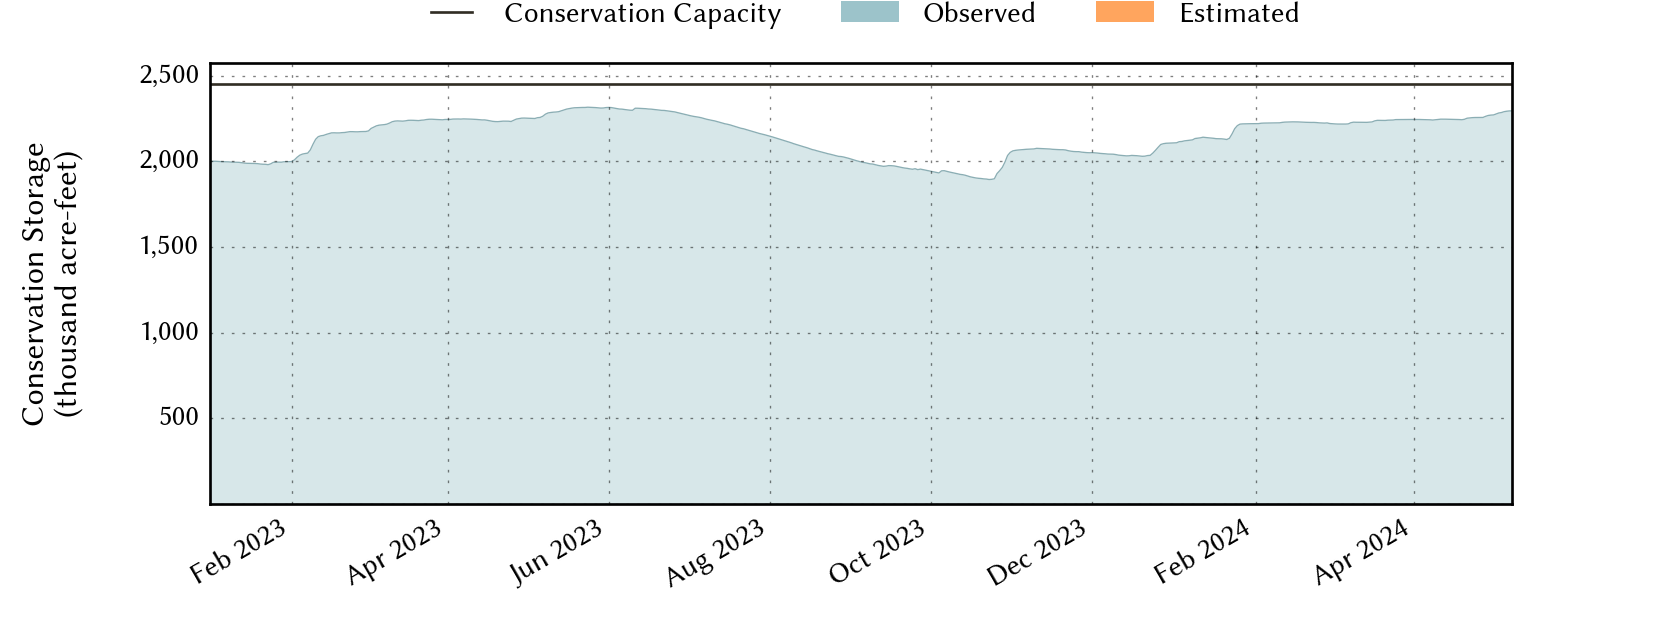
| 6 months ago | 2023-10-27 | 79.4 | 1,980,671 | 1,945,451 | 2,451,597 |
| 1 year ago | 2023-04-27 | 91.6 | 2,295,327 | 2,246,777 | 2,451,597 |
*
Percent Full is based on Conservation Storage and Conservation Capacity and doesn't account for storage in flood pool.
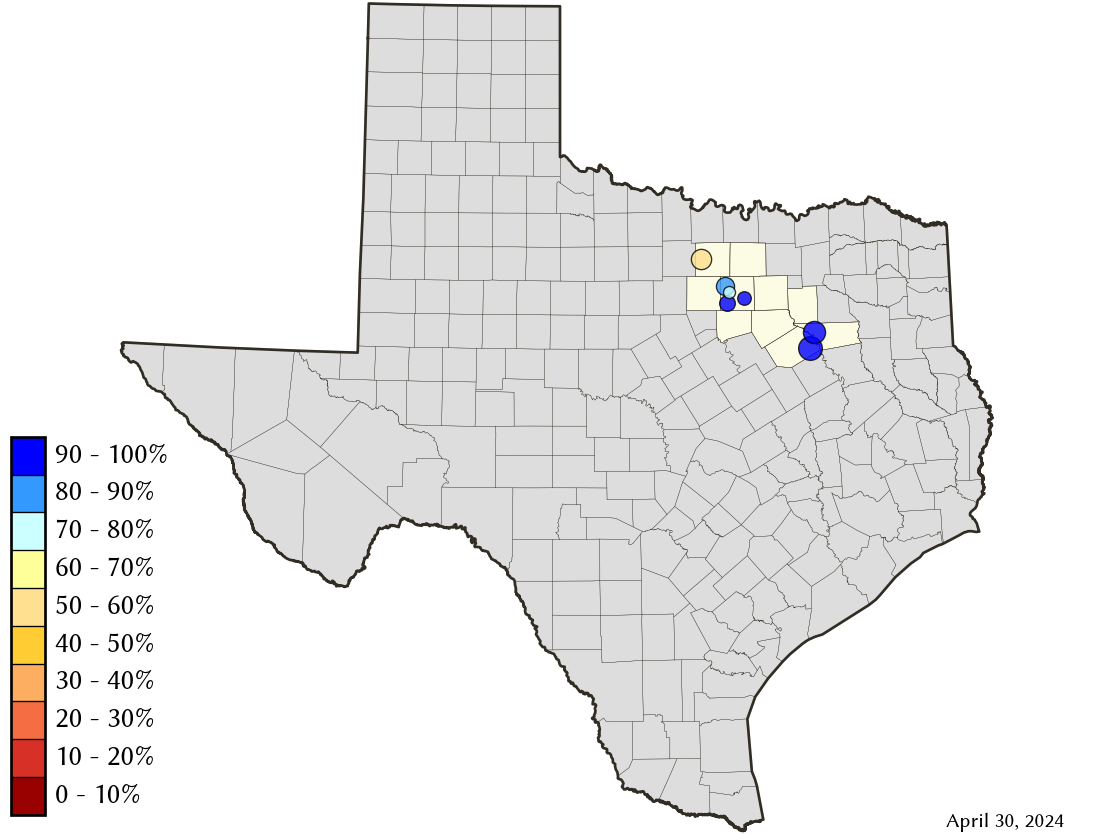
Area Map
Reservoir Storage
| Reservoir | Percent Full |
Water Level (ft) |
Height Above Conservation Pool (ft) |
Reservoir Storage (acre-ft) |
Conservation Storage (acre-ft) |
Conservation Capacity (acre-ft) |
Surface Area (acres) |
|---|---|---|---|---|---|---|---|
| Arlington | 100.0 | 550.35 | 0.35 | 40,863 | 40,157 | 40,157 | - n.a. - |
| Benbrook | 100.0 | 694.34 | 0.34 | 86,913 | 85,648 | 85,648 | - n.a. - |
| Bridgeport | 59.0 | 821.68 | -14.32 | 219,494 | 219,494 | 372,183 | 9,093 |
| Cedar Creek | 100.0 | 322.17 | 0.17 | 650,362 | 644,686 | 644,686 | - n.a. - |
| Eagle Mountain | 81.9 | 645.23 | -3.87 | 151,626 | 151,626 | 185,087 | 8,119 |
| Richland-Chambers | 100.0 | 315.22 | 0.22 | 1,134,872 | 1,099,417 | 1,099,417 | - n.a. - |
| Worth | 61.7 | 591.12 | -2.88 | 24,139 | 15,063 | 24,419 | 3,022 |