Region-B Planning Region Reservoirs: Monitored Water Supply Reservoirs are 64.1% full on 2024-04-27
Historical Data
| Date | Percent Full |
Reservoir Storage (acre-ft) |
Conservation Storage (acre-ft) |
Conservation Capacity (acre-ft) |
|
|---|---|---|---|---|---|
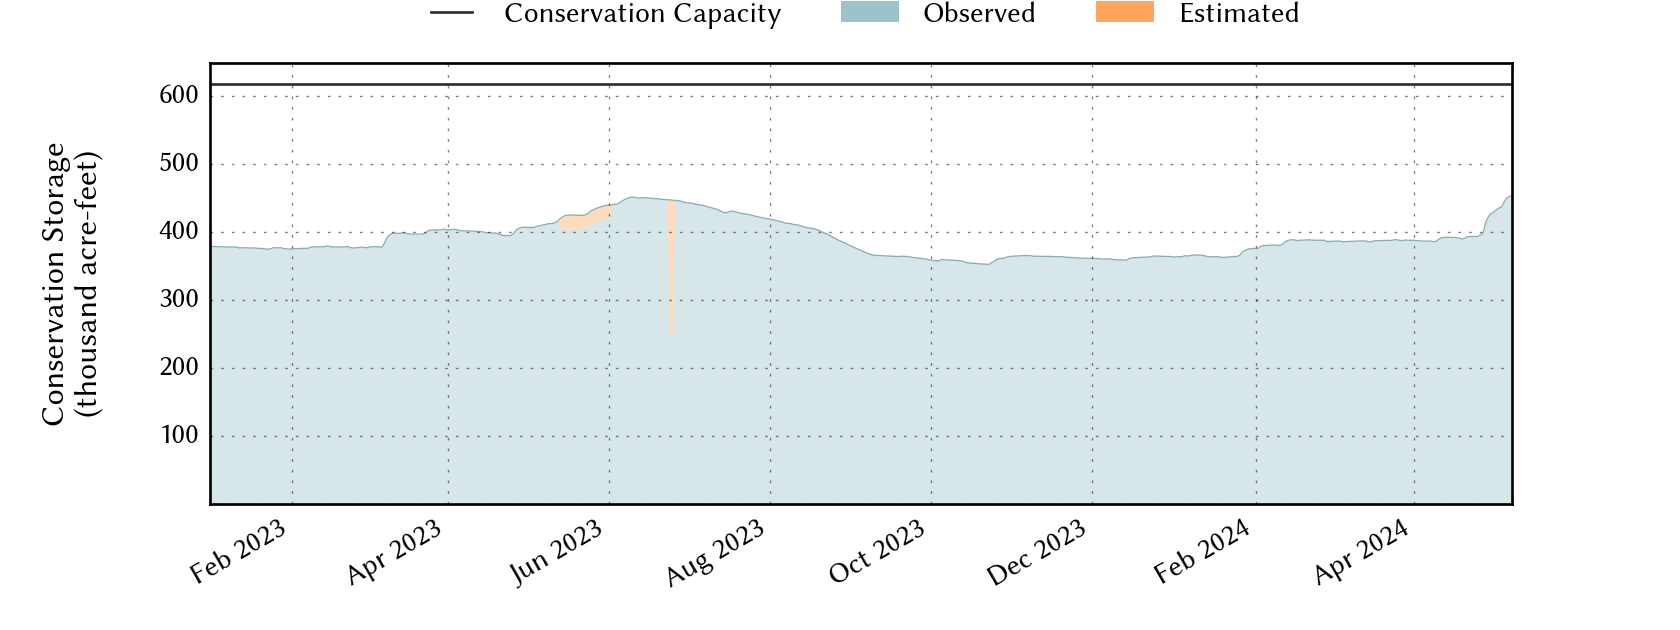
| Today | 2024-04-27 | 64.1 | 397,184 | 395,970 | 618,121 |
| Yesterday | 2024-04-26 | 64.1 | 397,184 | 395,970 | 618,121 |
| 2 days ago | 2024-04-25 | 63.7 | 394,842 | 393,628 | 618,121 |
| 1 week ago | 2024-04-20 | 63.2 | 392,172 | 390,958 | 618,121 |
| 1 month ago | 2024-03-27 | 62.8 | 389,140 | 387,926 | 618,121 |
| 3 months ago | 2024-01-27 | 60.0 | 372,102 | 370,888 | 618,121 |
| 6 months ago | 2023-10-27 | 58.4 | 362,345 | 361,131 | 618,121 |
| 1 year ago | 2023-04-27 | 65.2 | 404,463 | 403,249 | 618,121 |
*
Percent Full is based on Conservation Storage and Conservation Capacity and doesn't account for storage in flood pool.
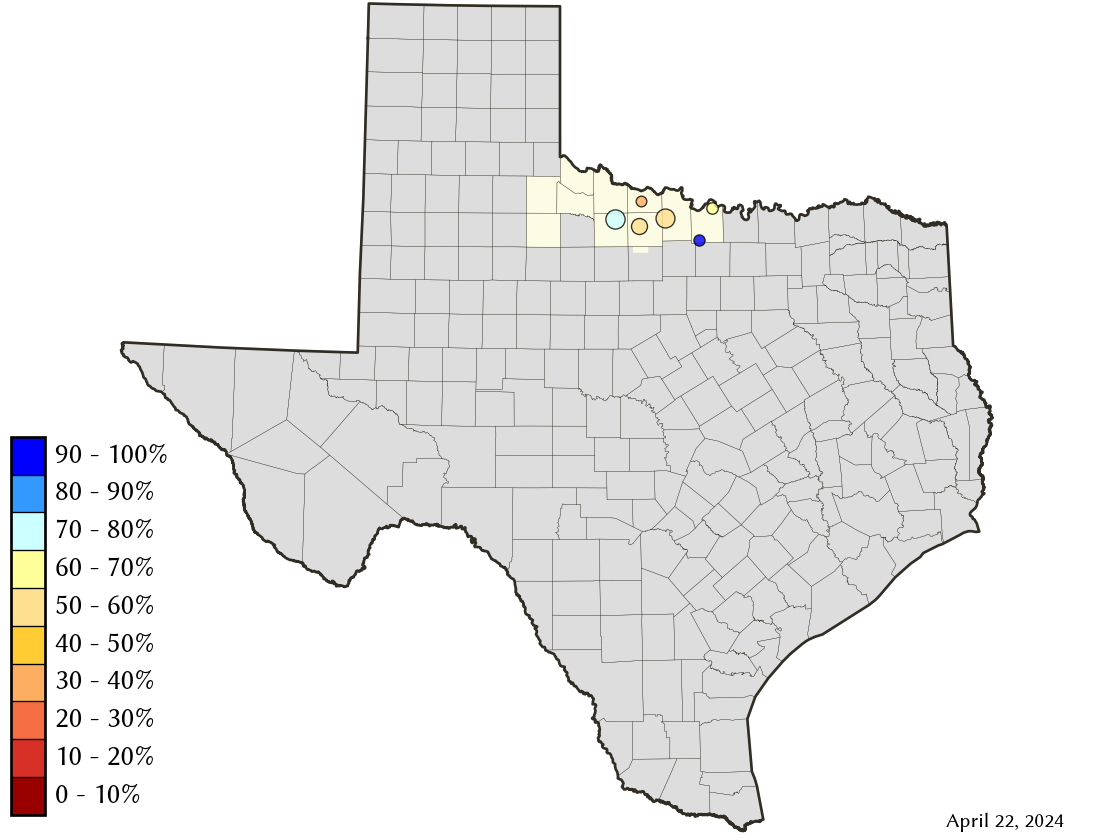
Area Map
Reservoir Storage
| Reservoir | Percent Full |
Water Level (ft) |
Height Above Conservation Pool (ft) |
Reservoir Storage (acre-ft) |
Conservation Storage (acre-ft) |
Conservation Capacity (acre-ft) |
Surface Area (acres) |
|---|---|---|---|---|---|---|---|
| Amon G Carter | 99.4 | 919.92 | -0.08 | 19,937 | 19,153 | 19,266 | 1,484 |
| Arrowhead | 56.0 | 917.82 | -8.18 | 128,957 | 128,957 | 230,359 | 10,287 |
| Kemp | 73.9 | 1,139.60 | -4.40 | 181,358 | 181,232 | 245,307 | 9,822 |
| Kickapoo | 54.9 | 1,037.17 | -7.83 | 47,398 | 47,398 | 86,345 | 4,084 |
| Nocona | 67.0 | 821.74 | -5.76 | 14,662 | 14,358 | 21,444 | 1,102 |
| North Fork Buffalo Creek | 31.6 | 1,039.06 | -8.94 | 4,872 | 4,872 | 15,400 | 700 |