Lower-Colorado Planning Region Reservoirs: Monitored Water Supply Reservoirs are 45.5% full on 2024-04-27
Historical Data
| Date | Percent Full |
Reservoir Storage (acre-ft) |
Conservation Storage (acre-ft) |
Conservation Capacity (acre-ft) |
|
|---|---|---|---|---|---|
| Today | 2024-04-27 | 45.5 | 1,016,261 | 965,835 | 2,122,814 |
| Yesterday | 2024-04-26 | 45.5 | 1,016,342 | 965,916 | 2,122,814 |
| 2 days ago | 2024-04-25 | 45.5 | 1,016,794 | 966,368 | 2,122,814 |
| 1 week ago | 2024-04-20 | 45.6 | 1,017,865 | 967,439 | 2,122,814 |
| 1 month ago | 2024-03-27 | 45.8 | 1,021,770 | 971,344 | 2,122,814 |
| 3 months ago | 2024-01-27 | 45.4 | 1,014,245 | 963,819 | 2,122,814 |
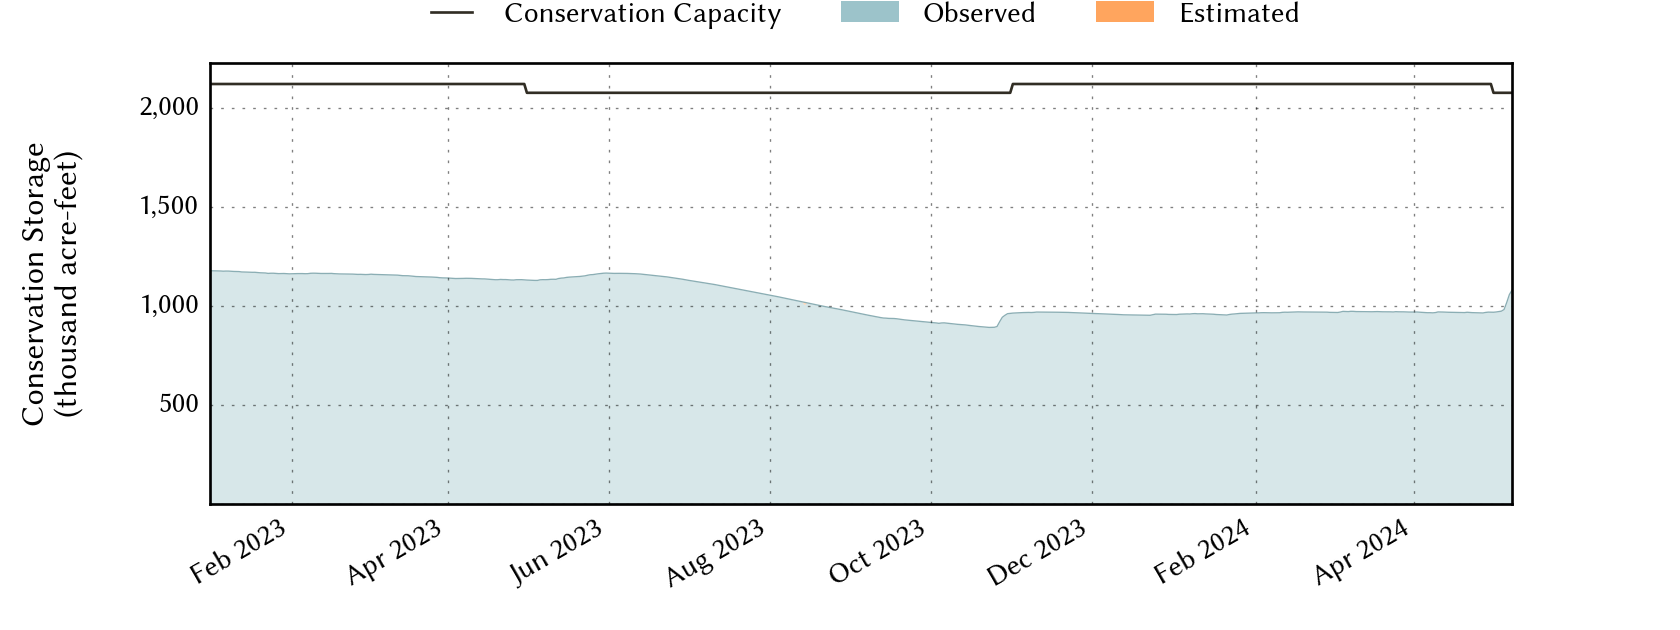
| 6 months ago | 2023-10-27 | 44.3 | 971,690 | 921,264 | 2,078,327 |
| 1 year ago | 2023-04-27 | 53.4 | 1,184,013 | 1,133,587 | 2,122,814 |
*
Percent Full is based on Conservation Storage and Conservation Capacity and doesn't account for storage in flood pool.
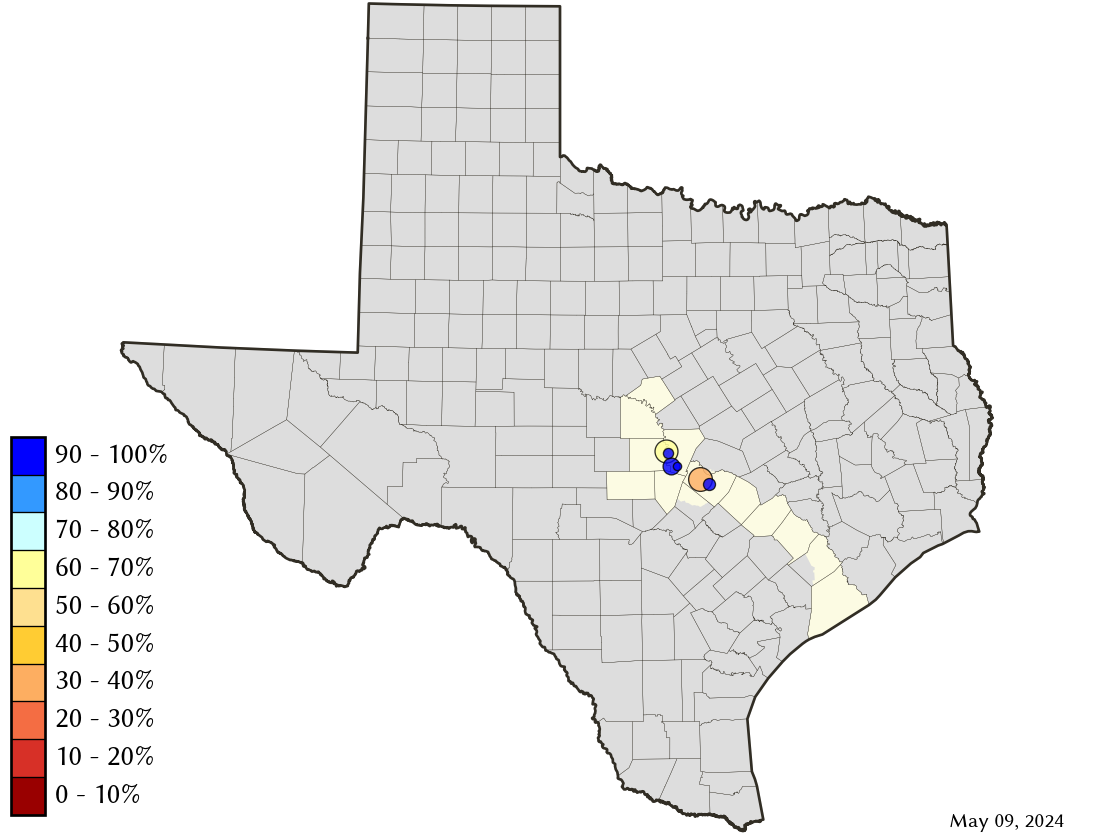
Area Map
Reservoir Storage
| Reservoir | Percent Full |
Water Level (ft) |
Height Above Conservation Pool (ft) |
Reservoir Storage (acre-ft) |
Conservation Storage (acre-ft) |
Conservation Capacity (acre-ft) |
Surface Area (acres) |
|---|---|---|---|---|---|---|---|
| Austin | 96.1 | 492.20 | -0.60 | 23,643 | 23,034 | 23,972 | 1,545 |
| Buchanan | 46.7 | 995.20 | -24.80 | 418,347 | 404,685 | 866,694 | 14,277 |
| Inks | 94.2 | 887.00 | -1.00 | 13,218 | 12,935 | 13,729 | 776 |
| Lyndon B Johnson | 98.3 | 824.71 | -0.29 | 129,757 | 110,917 | 112,778 | 6,405 |
| Marble Falls | 95.1 | 736.38 | -0.62 | 7,221 | 7,221 | 7,597 | 601 |
| Travis | 37.1 | 630.28 | -50.72 | 424,075 | 407,043 | 1,098,044 | 9,217 |