South-Central-Texas Planning Region Reservoirs: Monitored Water Supply Reservoirs are 39.1% full on 2024-04-27
Historical Data
| Date | Percent Full |
Reservoir Storage (acre-ft) |
Conservation Storage (acre-ft) |
Conservation Capacity (acre-ft) |
|
|---|---|---|---|---|---|
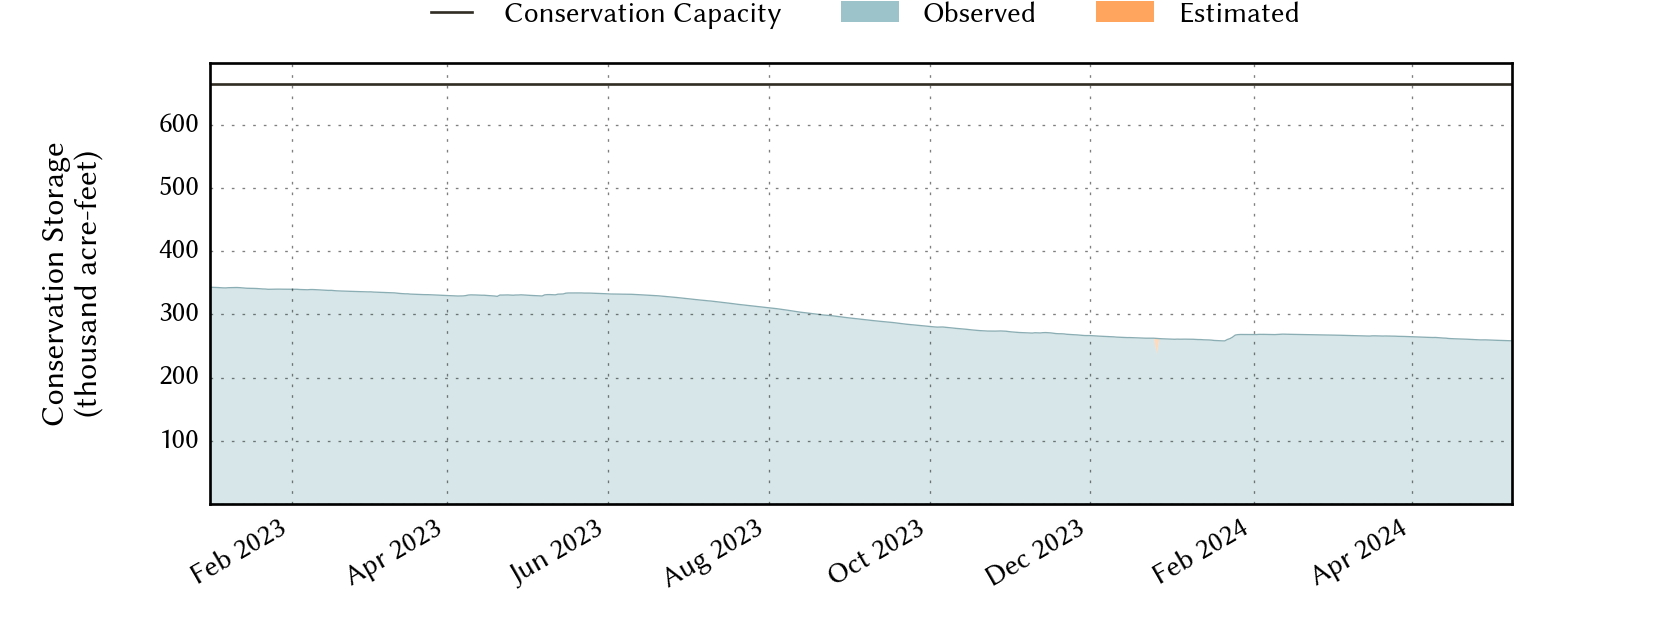
| Today | 2024-04-27 | 39.1 | 259,898 | 259,827 | 664,644 |
| Yesterday | 2024-04-26 | 39.1 | 259,898 | 259,827 | 664,644 |
| 2 days ago | 2024-04-25 | 39.1 | 260,133 | 260,062 | 664,644 |
| 1 week ago | 2024-04-20 | 39.3 | 261,138 | 261,067 | 664,644 |
| 1 month ago | 2024-03-27 | 39.9 | 265,848 | 265,304 | 664,644 |
| 3 months ago | 2024-01-27 | 40.4 | 269,421 | 268,256 | 664,644 |
| 6 months ago | 2023-10-27 | 41.2 | 273,854 | 273,783 | 664,644 |
| 1 year ago | 2023-04-27 | 49.8 | 330,776 | 330,705 | 664,644 |
*
Percent Full is based on Conservation Storage and Conservation Capacity and doesn't account for storage in flood pool.
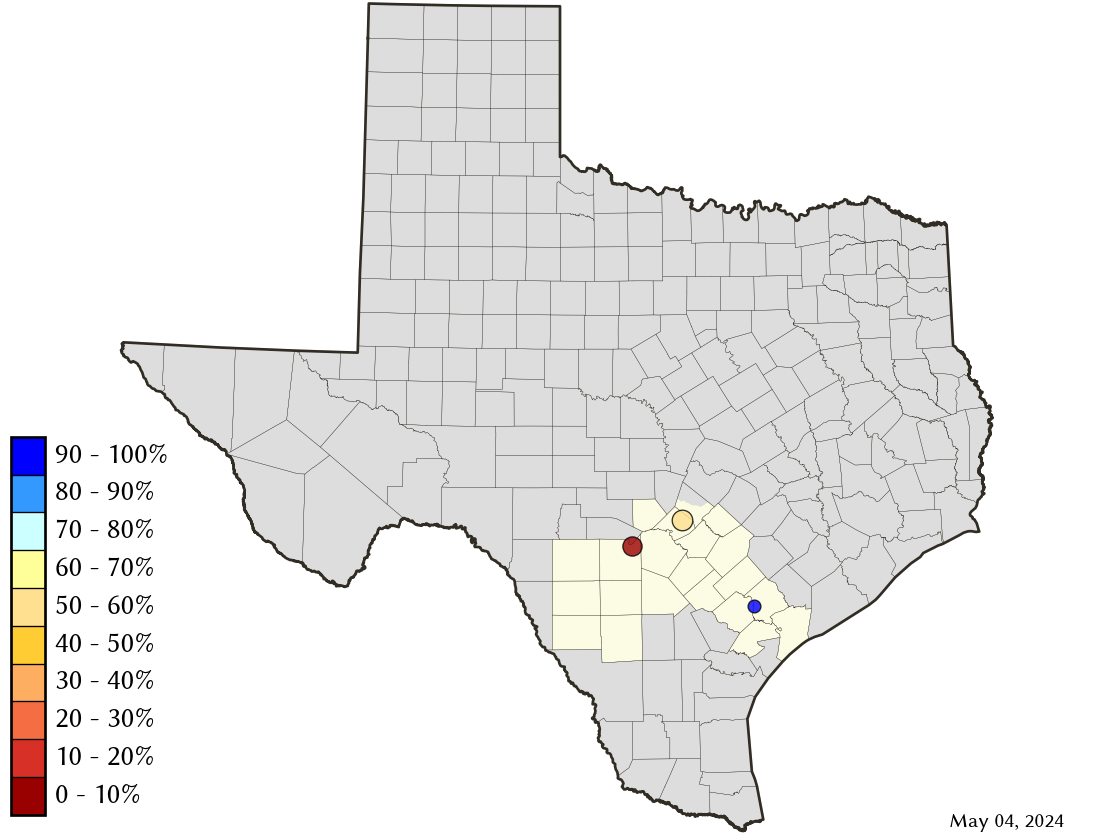
Area Map
Reservoir Storage
| Reservoir | Percent Full |
Water Level (ft) |
Height Above Conservation Pool (ft) |
Reservoir Storage (acre-ft) |
Conservation Storage (acre-ft) |
Conservation Capacity (acre-ft) |
Surface Area (acres) |
|---|---|---|---|---|---|---|---|
| Canyon | 58.8 | 886.63 | -22.37 | 222,724 | 222,653 | 378,781 | 5,810 |
| Coleto Creek | 97.1 | 97.62 | -0.38 | 30,149 | 30,149 | 31,040 | 2,600 |
| Medina | 2.8 | 972.57 | -91.63 | 7,025 | 7,025 | 254,823 | 613 |