Austin Area Reservoirs: Monitored Water Supply Reservoirs are 44.5% full on 2024-04-27
Historical Data
| Date | Percent Full |
Reservoir Storage (acre-ft) |
Conservation Storage (acre-ft) |
Conservation Capacity (acre-ft) |
|
|---|---|---|---|---|---|
| Today | 2024-04-27 | 44.5 | 1,024,664 | 993,821 | 2,232,539 |
| Yesterday | 2024-04-26 | 44.5 | 1,024,630 | 993,787 | 2,232,539 |
| 2 days ago | 2024-04-25 | 44.5 | 1,024,861 | 994,018 | 2,232,539 |
| 1 week ago | 2024-04-20 | 44.5 | 1,024,905 | 994,062 | 2,232,539 |
| 1 month ago | 2024-03-27 | 44.1 | 1,016,102 | 985,259 | 2,232,539 |
| 3 months ago | 2024-01-27 | 43.5 | 1,001,010 | 970,167 | 2,232,539 |
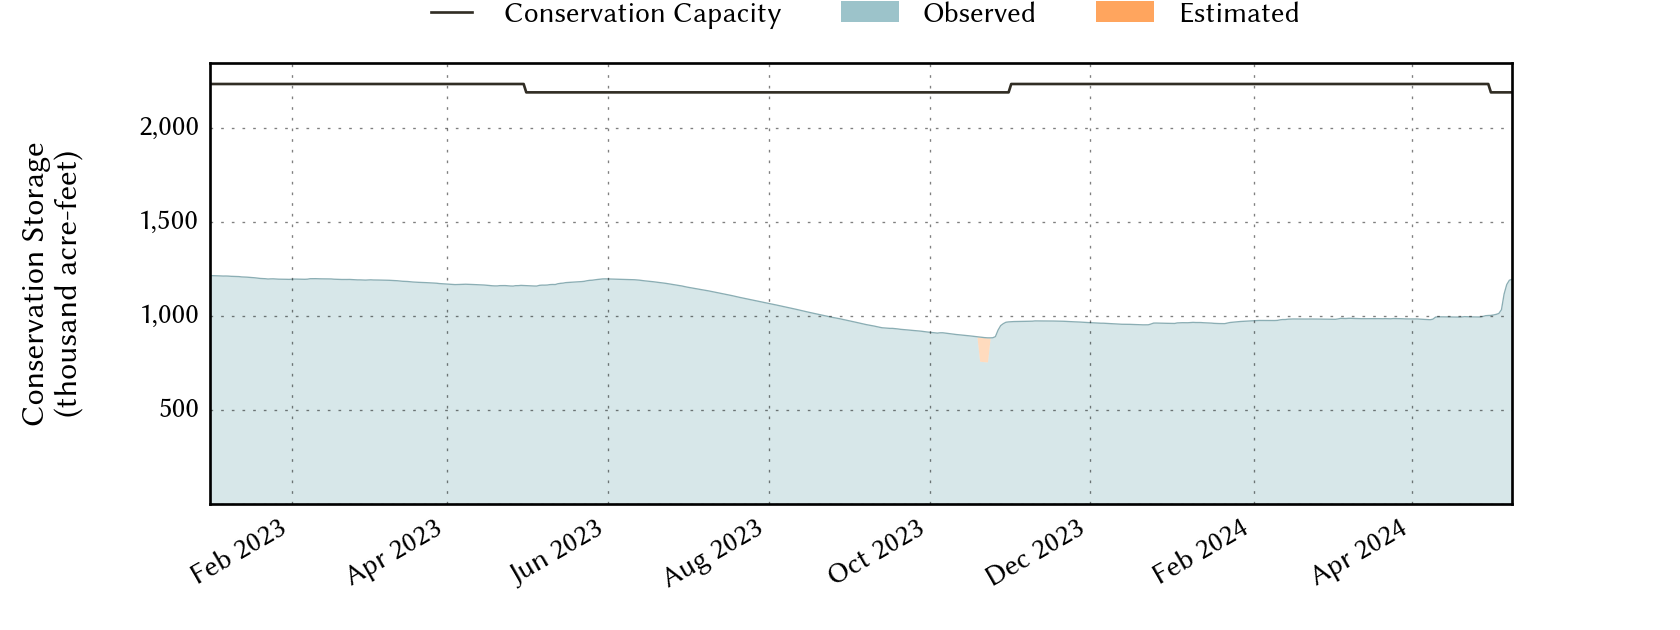
| 6 months ago | 2023-10-27 | 42.2 | 954,985 | 924,142 | 2,188,052 |
| 1 year ago | 2023-04-27 | 52.0 | 1,191,435 | 1,160,592 | 2,232,539 |
*
Percent Full is based on Conservation Storage and Conservation Capacity and doesn't account for storage in flood pool.
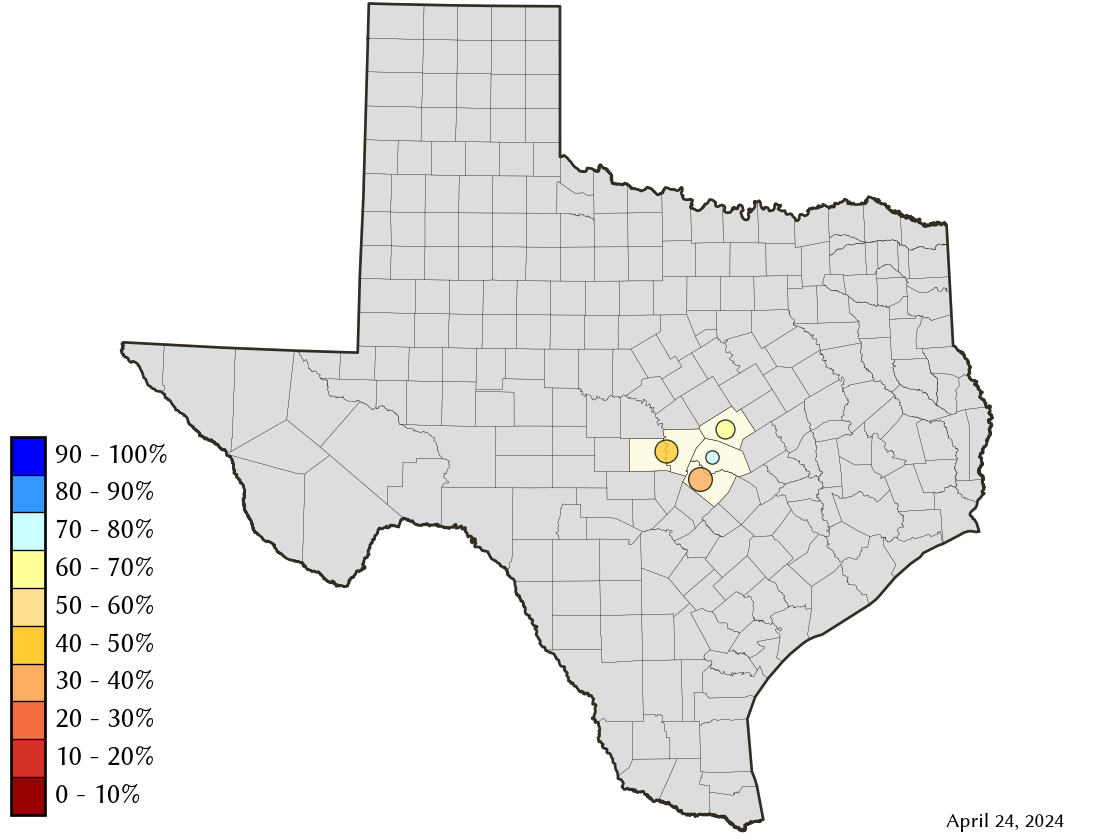
Area Map
Reservoir Storage
| Reservoir | Percent Full |
Water Level (ft) |
Height Above Conservation Pool (ft) |
Reservoir Storage (acre-ft) |
Conservation Storage (acre-ft) |
Conservation Capacity (acre-ft) |
Surface Area (acres) |
|---|---|---|---|---|---|---|---|
| Buchanan | 46.7 | 995.19 | -24.81 | 418,204 | 404,542 | 866,694 | 14,275 |
| Georgetown | 79.6 | 784.66 | -6.34 | 30,319 | 30,256 | 38,005 | 1,139 |
| Stillhouse Hollow | 66.1 | 607.74 | -14.26 | 151,882 | 151,796 | 229,796 | 4,596 |
| Travis | 37.1 | 630.30 | -50.70 | 424,259 | 407,227 | 1,098,044 | 9,220 |