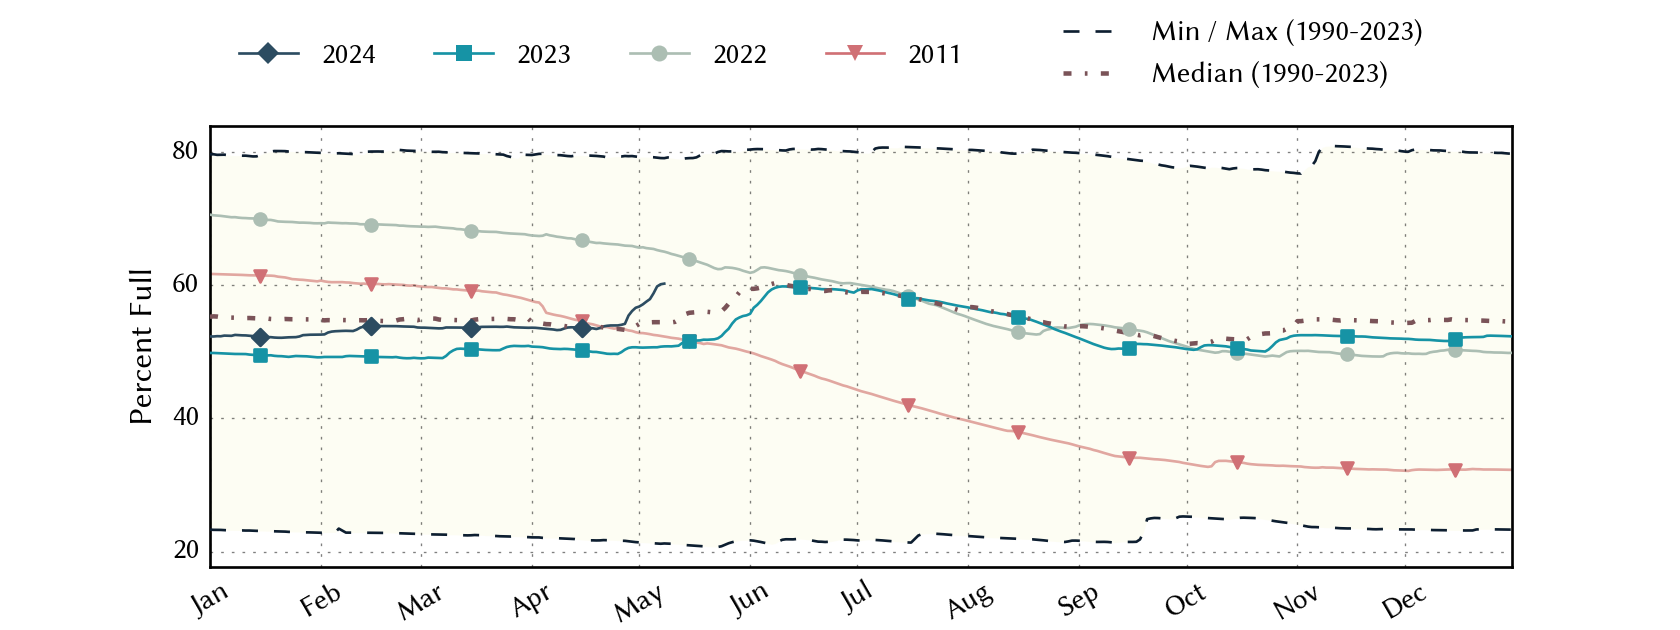
Low-Rolling-Plains Climate Division Reservoirs: Monitored Water Supply Reservoirs are 53.4% full on 2024-04-27
Historical Data
| Date | Percent Full |
Reservoir Storage (acre-ft) |
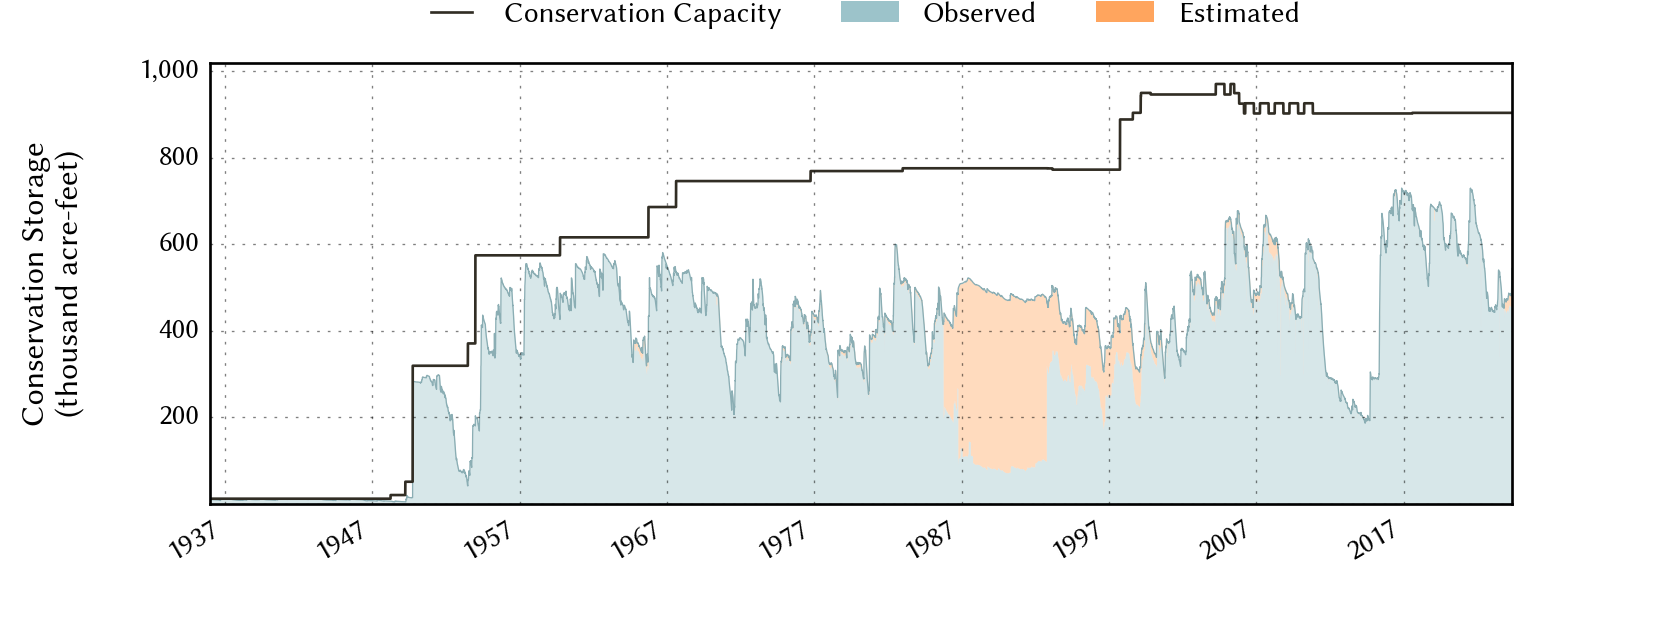
Conservation Storage (acre-ft) |
Conservation Capacity (acre-ft) |
|
|---|---|---|---|---|---|
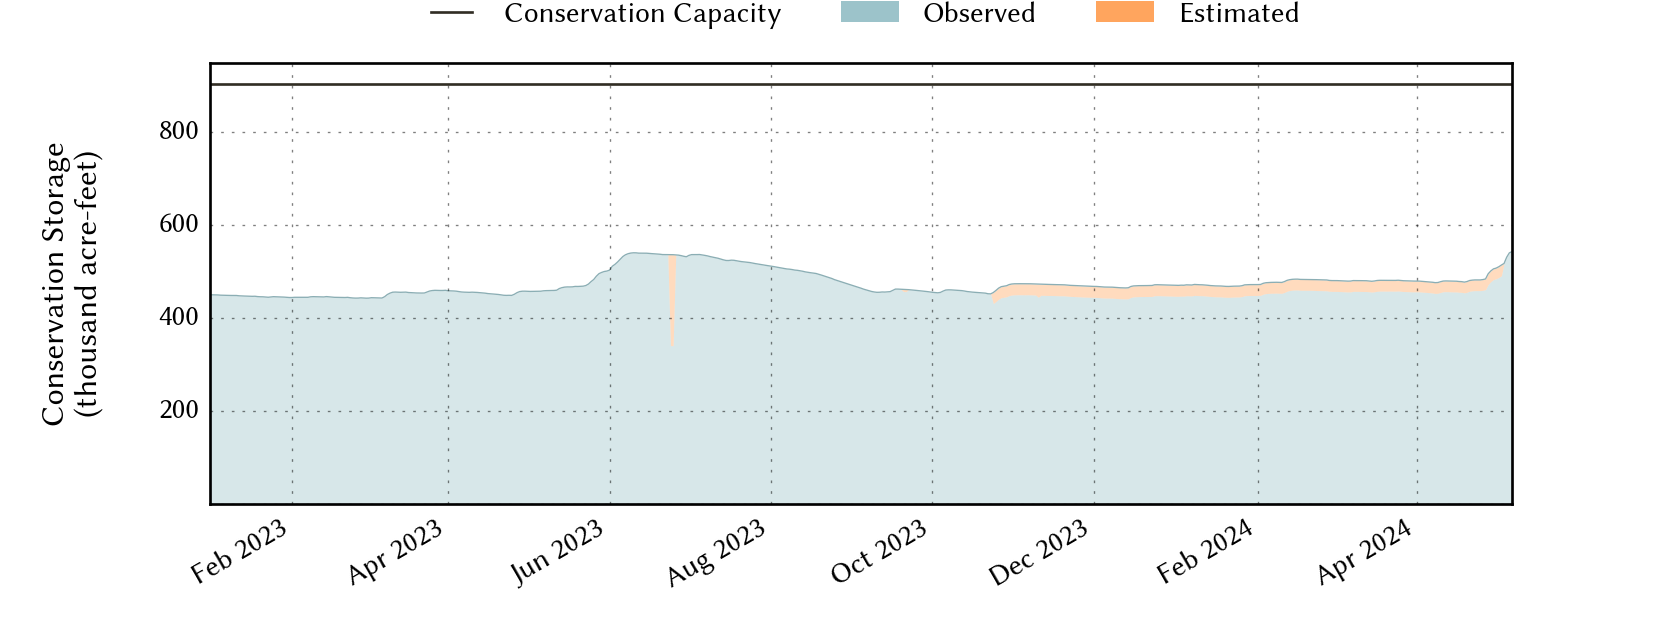
| Today | 2024-04-27 | 53.4 | 484,874 | 482,330 | 903,870 |
| Yesterday | 2024-04-26 | 53.4 | 484,925 | 482,381 | 903,870 |
| 2 days ago | 2024-04-25 | 53.3 | 484,177 | 481,633 | 903,870 |
| 1 week ago | 2024-04-20 | 53.1 | 482,591 | 480,047 | 903,870 |
| 1 month ago | 2024-03-27 | 53.3 | 484,548 | 482,004 | 903,870 |
| 3 months ago | 2024-01-27 | 52.4 | 475,901 | 473,357 | 903,870 |
| 6 months ago | 2023-10-27 | 51.7 | 470,085 | 467,541 | 903,870 |
| 1 year ago | 2023-04-27 | 50.3 | 457,340 | 454,796 | 903,870 |
*
Percent Full is based on Conservation Storage and Conservation Capacity and doesn't account for storage in flood pool.
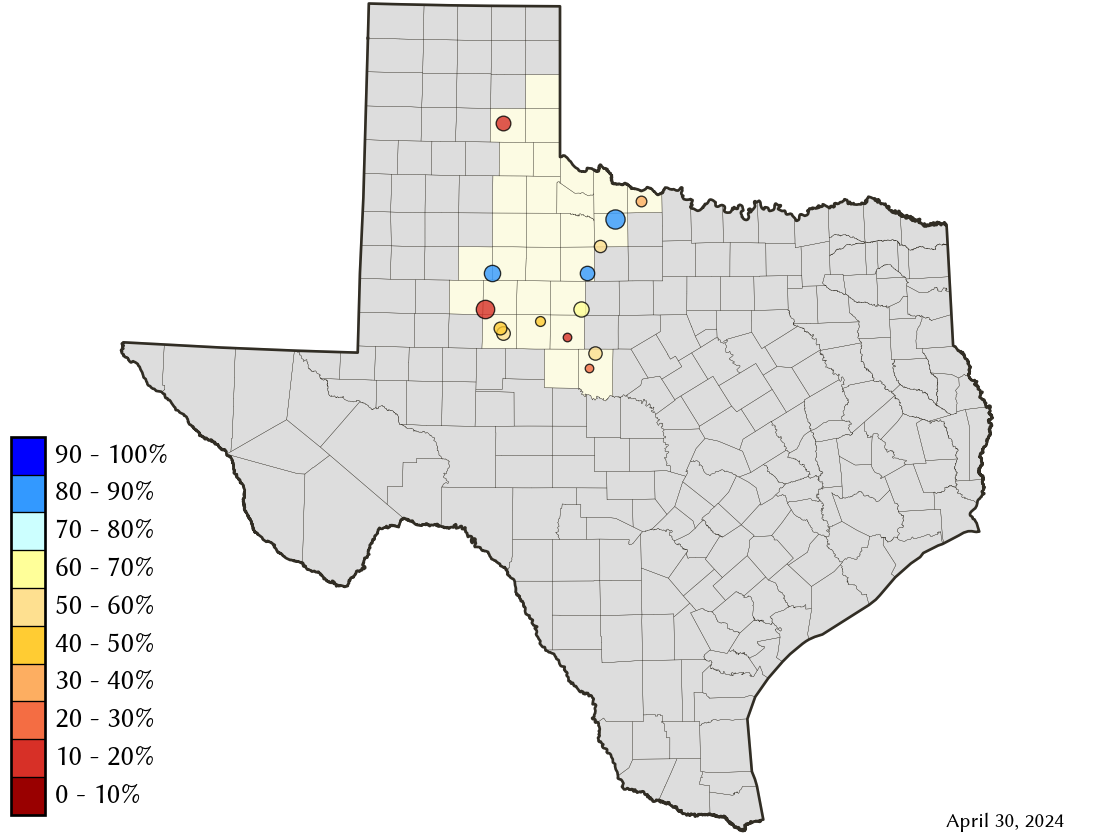
Area Map
Reservoir Storage
| Reservoir | Percent Full |
Water Level (ft) |
Height Above Conservation Pool (ft) |
Reservoir Storage (acre-ft) |
Conservation Storage (acre-ft) |
Conservation Capacity (acre-ft) |
Surface Area (acres) |
|---|---|---|---|---|---|---|---|
| Abilene | 11.7 | 1,993.65 | -18.65 | 922 | 922 | 7,900 | 167 |
| Alan Henry | 87.0 | 2,215.26 | -4.74 | 83,728 | 83,728 | 96,207 | 2,465 |
| Champion Creek | 57.2 | 2,068.88 | -14.12 | 23,789 | 23,789 | 41,580 | 1,031 |
| Coleman | 62.6 | 1,708.79 | -8.71 | 23,841 | 23,823 | 38,075 | 1,412 |
| Colorado City | 46.4 | 2,056.79 | -13.41 | 14,267 | 14,267 | 30,758 | - n.a. - |
| Fort Phantom Hill | 66.6 | 1,629.04 | -6.86 | 46,661 | 46,655 | 70,030 | 2,973 |
| Greenbelt | 11.3 | 2,618.06 | -45.94 | 7,217 | 6,785 | 59,968 | 465 |
| Hords Creek | 21.3 | 1,879.13 | -20.87 | 1,733 | 1,730 | 8,109 | 165 |
| J B Thomas | 19.5 | 2,225.75 | -32.25 | 39,681 | 39,008 | 199,931 | 3,066 |
| Kemp | 73.9 | 1,139.60 | -4.40 | 181,358 | 181,232 | 245,307 | 9,822 |
| Millers Creek | 49.4 | 1,325.88 | -8.12 | 14,495 | 13,212 | 26,768 | 1,183 |
| North Fork Buffalo Creek | 31.6 | 1,039.06 | -8.94 | 4,872 | 4,872 | 15,400 | 700 |
| Stamford | 71.3 | 1,413.78 | -3.02 | 36,763 | 36,760 | 51,570 | 3,990 |
| Sweetwater | 45.2 | 2,103.06 | -13.44 | 5,547 | 5,547 | 12,267 | 371 |