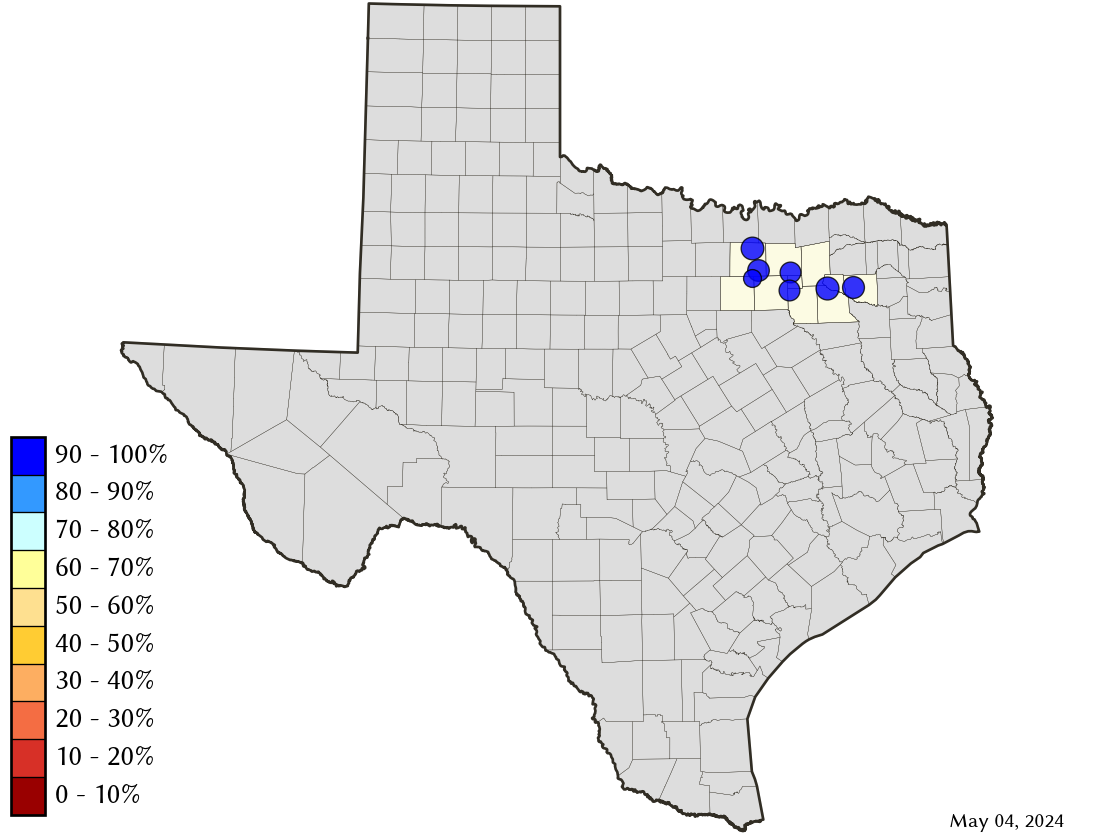
Dallas Area Reservoirs: Monitored Water Supply Reservoirs are 100.0% full on 2024-04-27
Historical Data
| Date | Percent Full |
Reservoir Storage (acre-ft) |
Conservation Storage (acre-ft) |
Conservation Capacity (acre-ft) |
|
|---|---|---|---|---|---|
| Today | 2024-04-27 | 100.0 | 4,060,732 | 3,840,521 | 3,840,521 |
| Yesterday | 2024-04-26 | 100.0 | 4,060,320 | 3,840,521 | 3,840,521 |
| 2 days ago | 2024-04-25 | 100.0 | 4,072,289 | 3,840,521 | 3,840,521 |
| 1 week ago | 2024-04-20 | 100.0 | 4,022,285 | 3,840,521 | 3,840,521 |
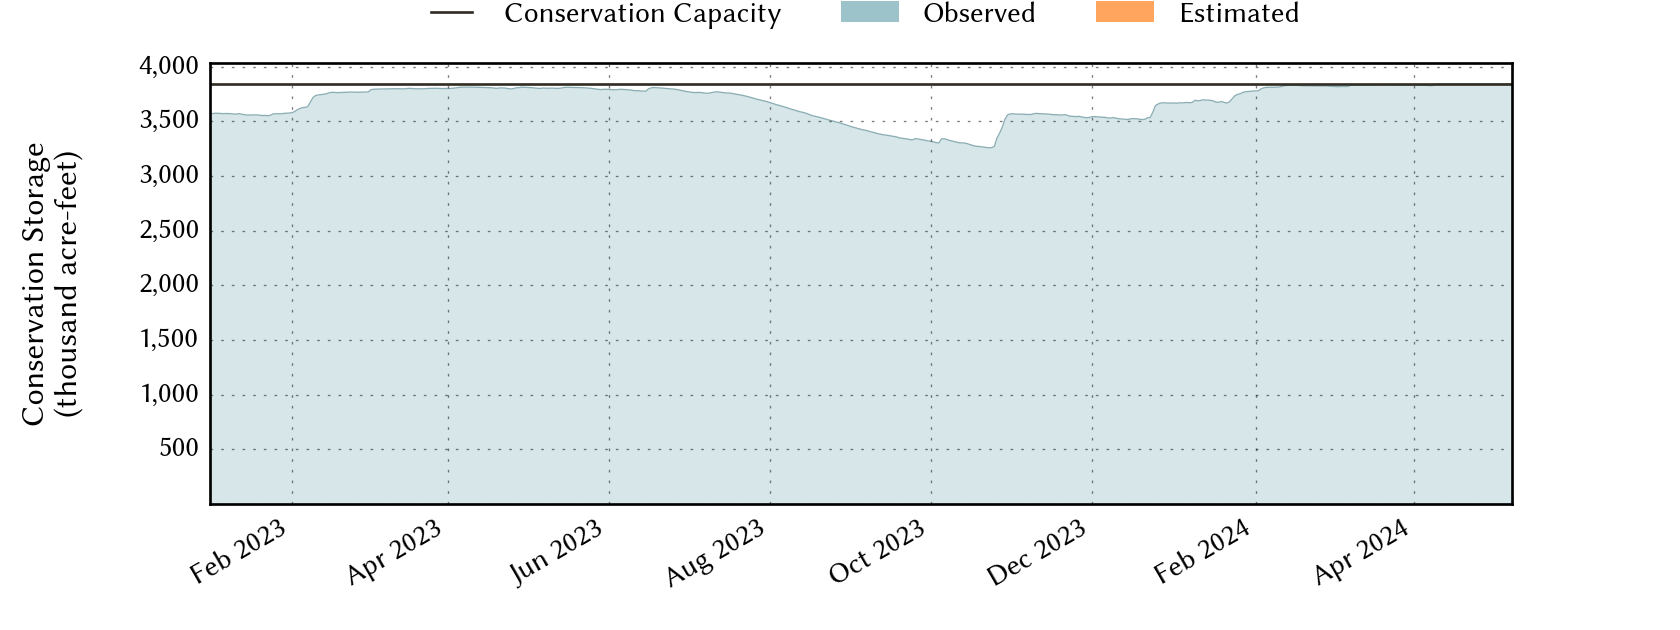
| 1 month ago | 2024-03-27 | 99.8 | 4,049,301 | 3,832,322 | 3,840,521 |
| 3 months ago | 2024-01-27 | 98.0 | 3,872,805 | 3,763,426 | 3,840,521 |
| 6 months ago | 2023-10-27 | 88.3 | 3,461,147 | 3,390,858 | 3,840,521 |
| 1 year ago | 2023-04-27 | 99.1 | 3,884,640 | 3,805,630 | 3,840,521 |
*
Percent Full is based on Conservation Storage and Conservation Capacity and doesn't account for storage in flood pool.
Area Map
Reservoir Storage
| Reservoir | Percent Full |
Water Level (ft) |
Height Above Conservation Pool (ft) |
Reservoir Storage (acre-ft) |
Conservation Storage (acre-ft) |
Conservation Capacity (acre-ft) |
Surface Area (acres) |
|---|---|---|---|---|---|---|---|
| Fork | 100.0 | 403.34 | 0.34 | 645,574 | 605,061 | 605,061 | - n.a. - |
| Grapevine | 100.0 | 536.74 | 1.74 | 174,913 | 163,064 | 163,064 | - n.a. - |
| Lavon | 100.0 | 493.18 | 1.18 | 437,328 | 409,757 | 409,757 | 21,250 |
| Lewisville | 100.0 | 523.07 | 1.07 | 628,201 | 563,228 | 563,228 | - n.a. - |
| Ray Hubbard | 100.0 | 435.60 | 0.10 | 441,660 | 439,559 | 439,559 | 21,074 |
| Ray Roberts | 100.0 | 633.48 | 0.98 | 816,598 | 788,167 | 788,167 | - n.a. - |
| Tawakoni | 100.0 | 438.69 | 1.19 | 916,458 | 871,685 | 871,685 | - n.a. - |