Reservoir Storage Summary for River Basins on 2026-07-23
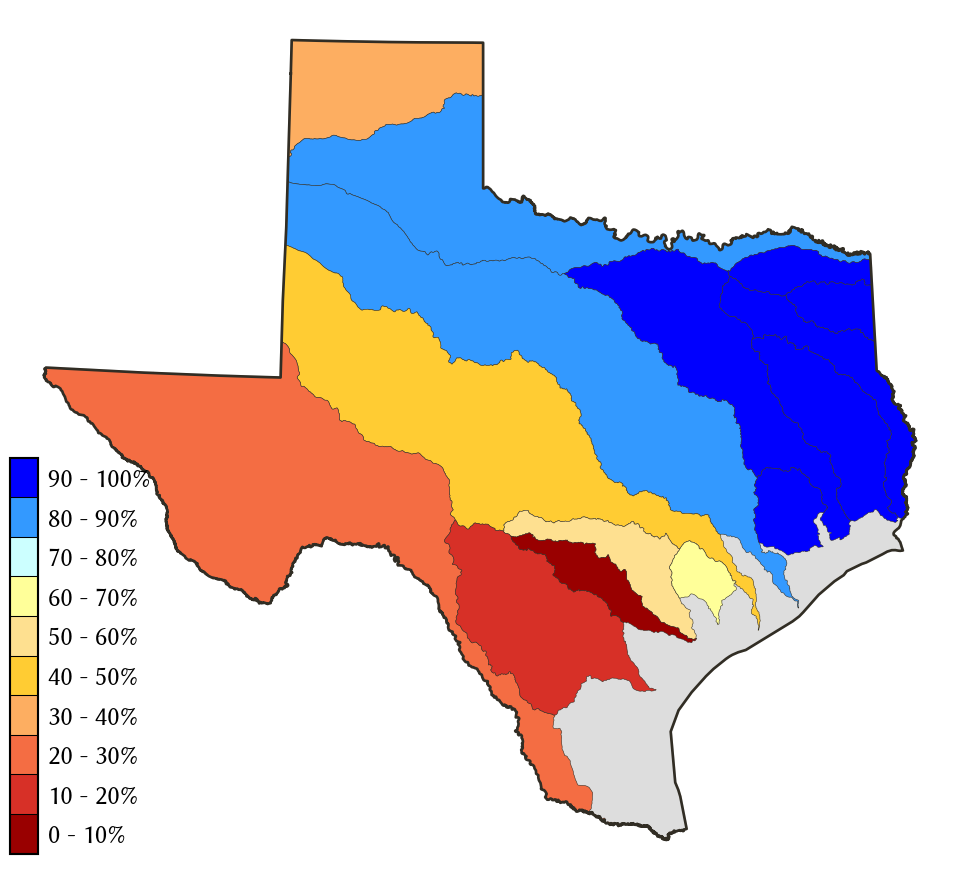
Percent Full
| Today | Yesterday | 2 days ago | 1 week ago | 1 month ago | 3 months ago | 6 months ago | 1 year ago | |
|---|---|---|---|---|---|---|---|---|
| 2026-07-23 | 2026-07-22 | 2026-07-21 | 2026-07-16 | 2026-06-23 | 2026-04-23 | 2026-01-23 | 2025-07-23 | |
| Brazos | 89.6 | 89.6 | 89.6 | 89.2 | 90.1 | 87.6 | 85.7 | 93.7 |
| Canadian | 38.7 | 38.7 | 38.8 | 38.9 | 39.6 | 40.3 | 41.7 | 42.0 |
| Colorado | 68.3 | 68.3 | 68.3 | 63.6 | 64.6 | 60.3 | 61.3 | 69.2 |
| Cypress | 94.5 | 94.7 | 94.9 | 95.1 | 95.0 | 96.8 | 95.4 | 98.7 |
| Guadalupe | 98.7 | 98.7 | 98.7 | 70.5 | 63.3 | 59.9 | 62.1 | 70.6 |
| Lavaca | 100.0 | 100.0 | 100.0 | 100.0 | 99.9 | 57.5 | 60.1 | 97.2 |
| Neches | 77.1 | 77.1 | 77.2 | 77.2 | 77.0 | 76.0 | 72.4 | 87.6 |
| Nueces | 16.5 | 15.2 | 14.9 | 15.1 | 15.0 | 7.8 | 9.7 | 14.9 |
| Red | 91.7 | 91.8 | 91.8 | 91.9 | 93.8 | 91.4 | 90.6 | 95.6 |
| Rio Grande | 33.3 | 33.2 | 32.9 | 28.5 | 28.6 | 27.6 | 28.6 | 25.9 |
| Sabine | 94.4 | 94.5 | 94.6 | 94.9 | 96.5 | 91.2 | 87.4 | 97.8 |
| San Antonio | 28.2 | 28.0 | 27.6 | 20.9 | 8.7 | 3.9 | 4.5 | 6.4 |
| San Jacinto | 99.4 | 99.5 | 99.5 | 100.0 | 99.5 | 93.5 | 95.8 | 99.8 |
| Sulphur | 91.1 | 91.3 | 91.5 | 92.1 | 93.4 | 86.2 | 79.2 | 99.3 |
| Trinity | 95.9 | 96.0 | 96.1 | 96.3 | 97.0 | 95.6 | 92.7 | 99.2 |
*
Percent Full is based on Conservation Storage and Conservation Capacity.
Recent Conditions
| Percent Full |
Reservoir Storage (acre-ft) |
Conservation Storage (acre-ft) |
Conservation Capacity (acre-ft) |
|
|---|---|---|---|---|
| Brazos | 89.6 | 3,276,322 | 3,202,672 | 3,576,076 |
| Canadian | 38.7 | 255,469 | 217,055 | 561,066 |
| Colorado | 68.3 | 2,834,862 | 2,744,423 | 4,019,576 |
| Cypress | 94.5 | 676,172 | 559,977 | 592,377 |
| Guadalupe | 98.7 | 408,162 | 404,621 | 409,821 |
| Lavaca | 100.0 | 164,897 | 158,975 | 158,975 |
| Neches | 77.1 | 2,709,117 | 2,679,841 | 3,477,212 |
| Nueces | 16.5 | 151,629 | 151,350 | 918,882 |
| Red | 91.7 | 3,635,463 | 2,268,967 | 2,474,646 |
| Rio Grande | 33.3 | 1,410,226 | 1,172,378 | 3,520,940 |
| Sabine | 94.4 | 5,790,957 | 3,652,787 | 3,868,328 |
| San Antonio | 28.2 | 71,877 | 71,877 | 254,823 |
| San Jacinto | 99.4 | 550,593 | 546,765 | 549,895 |
| Sulphur | 91.1 | 575,464 | 363,712 | 399,063 |
| Trinity | 95.9 | 6,585,513 | 6,497,413 | 6,776,855 |
**
The grey areas represent coastal basins that have no contributing reservoirs present.