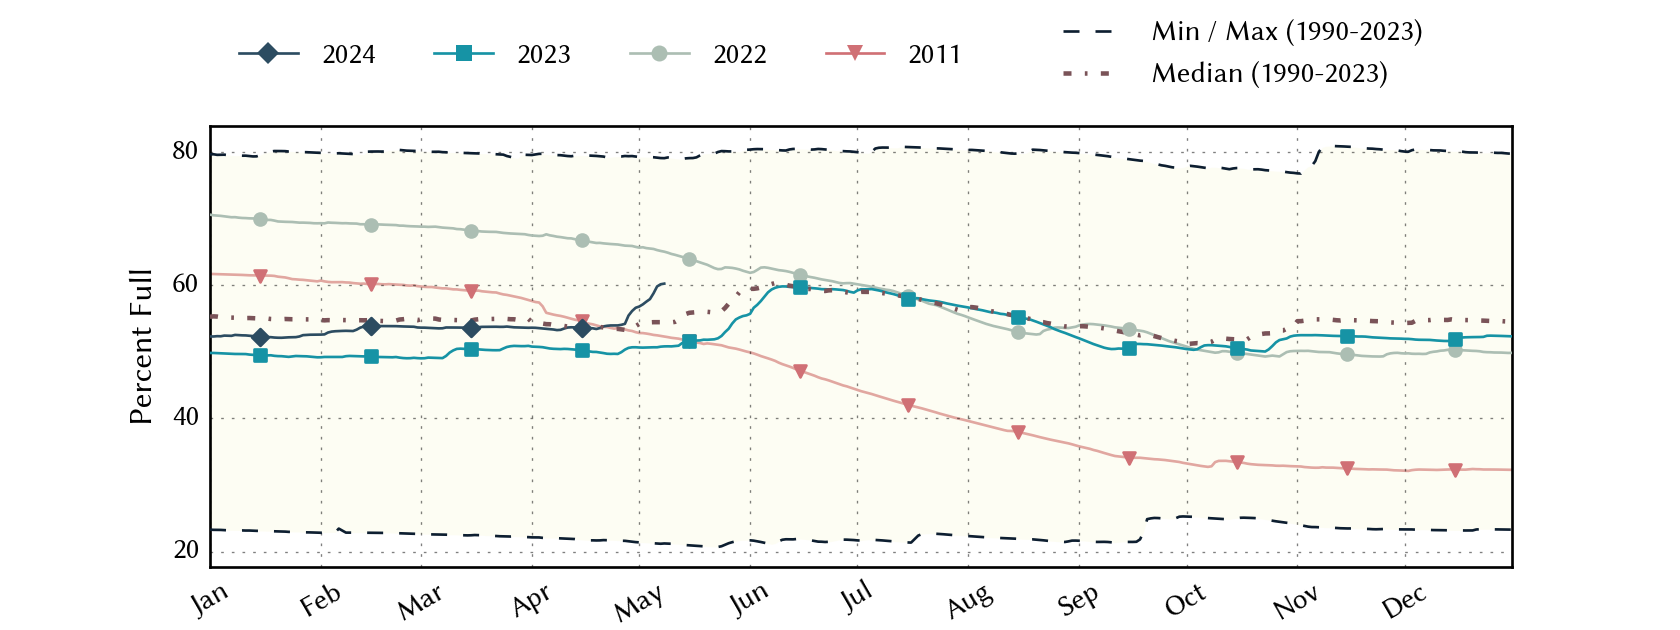
Low-Rolling-Plains Climate Division Reservoirs: Monitored Water Supply Reservoirs are 57.9% full on 2026-07-17
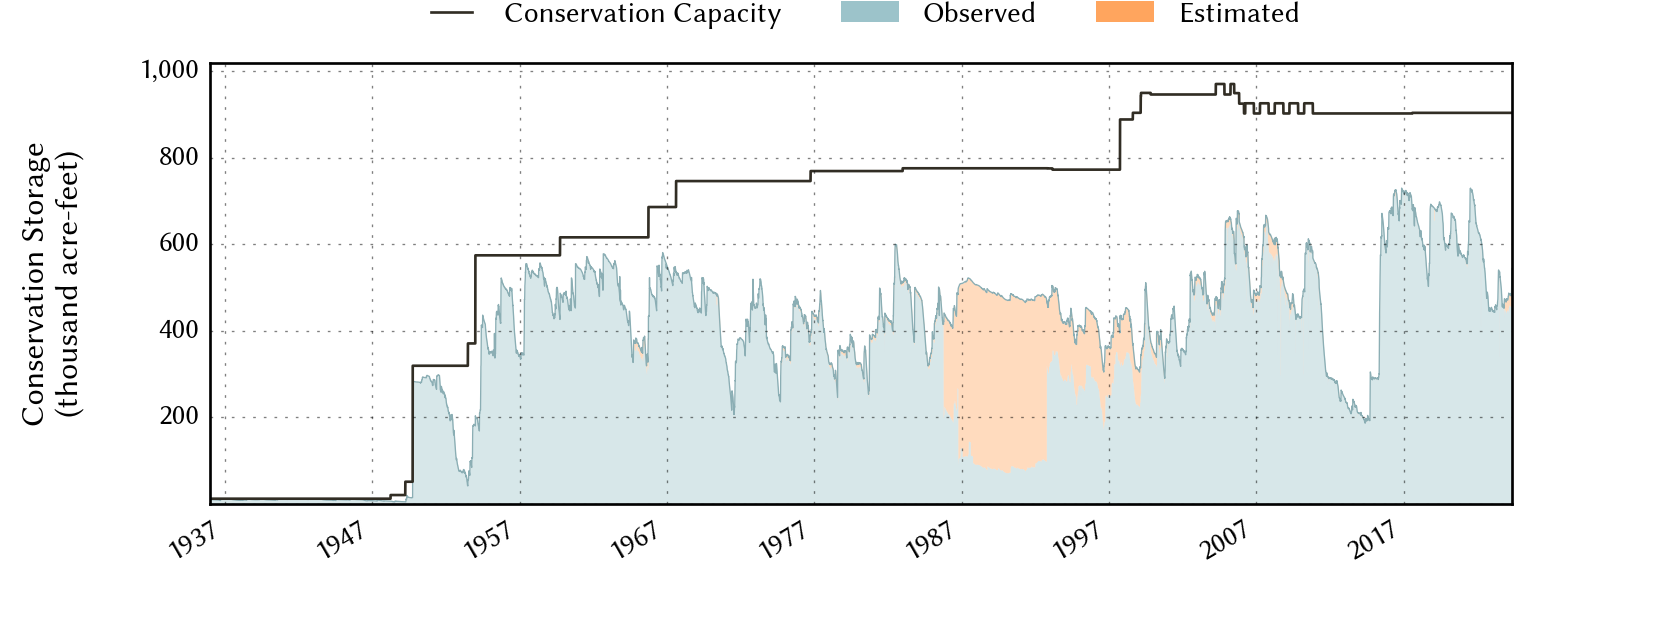
Historical Data
| Date | Percent Full |
Reservoir Storage (acre-ft) |
Conservation Storage (acre-ft) |
Conservation Capacity (acre-ft) |
|
|---|---|---|---|---|---|
| Today | 2026-07-17 | 57.9 | 526,224 | 523,680 | 903,870 |
| Yesterday | 2026-07-16 | 57.6 | 523,206 | 520,662 | 903,870 |
| 2 days ago | 2026-07-15 | 57.4 | 521,695 | 519,151 | 903,870 |
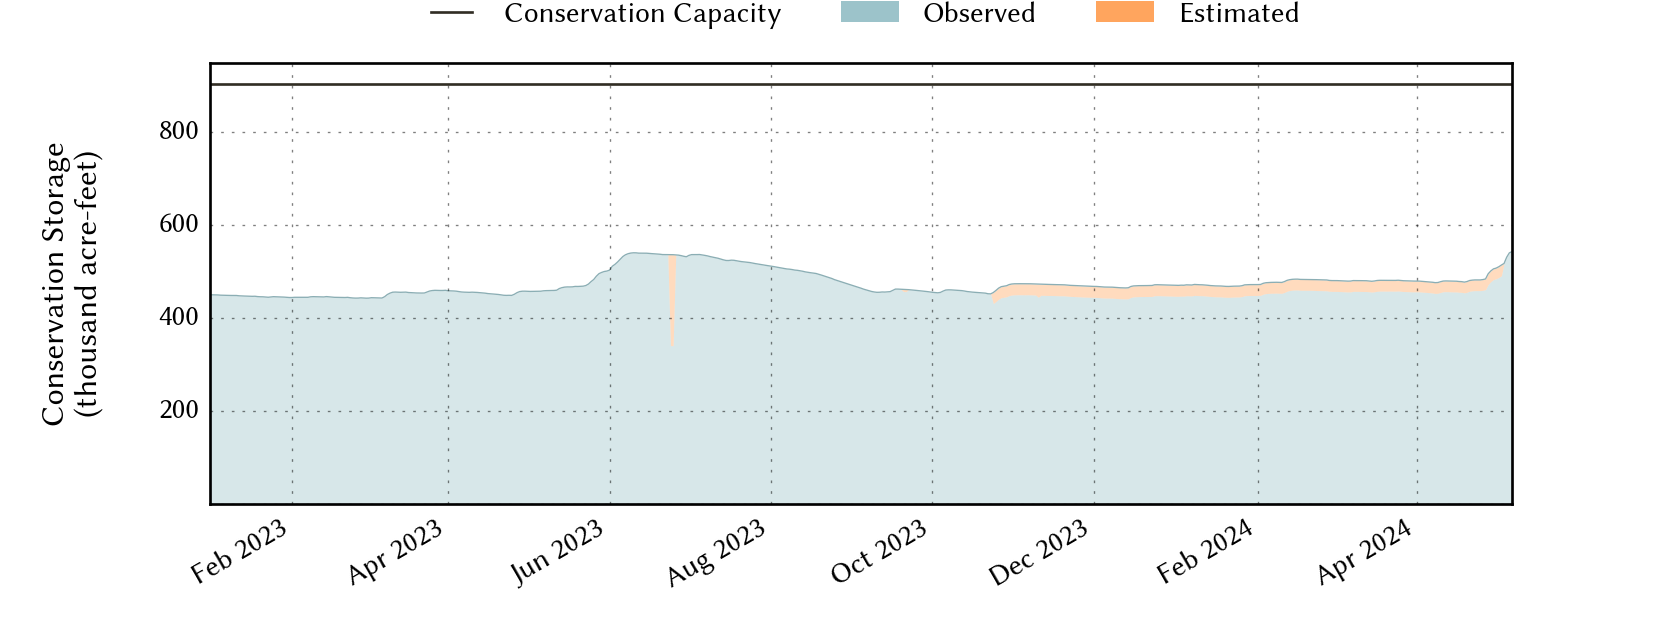
| 1 week ago | 2026-07-10 | 59.2 | 537,879 | 535,335 | 903,870 |
| 1 month ago | 2026-06-17 | 62.7 | 568,999 | 566,455 | 903,870 |
| 3 months ago | 2026-04-17 | 63.2 | 574,077 | 571,533 | 903,870 |
| 6 months ago | 2026-01-17 | 64.6 | 586,671 | 584,127 | 903,870 |
| 1 year ago | 2025-07-17 | 72.9 | 708,521 | 658,928 | 903,870 |
*
Percent Full is based on Conservation Storage and Conservation Capacity and doesn't account for storage in flood pool.
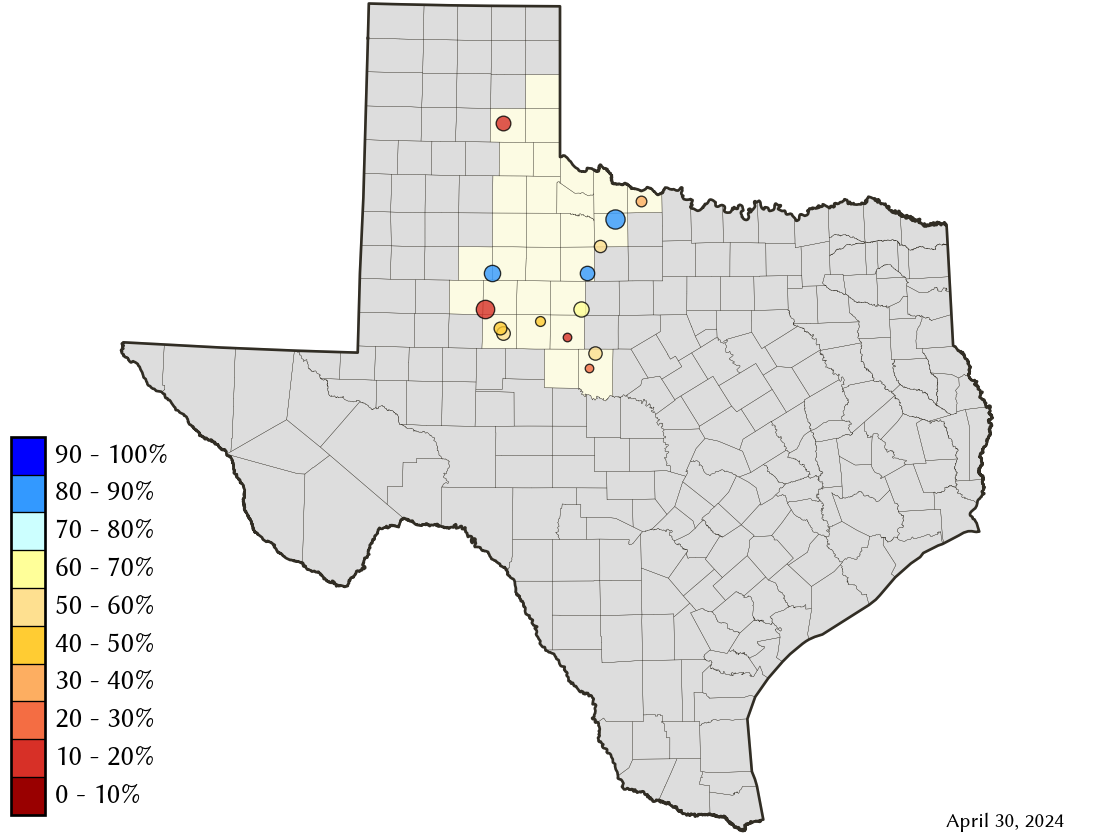
Area Map
Reservoir Storage
| Reservoir | Type | Percent Full |
Water Level (ft) |
Height Above Conservation Pool (ft) |
Reservoir Storage (acre-ft) |
Conservation Storage (acre-ft) |
Conservation Capacity (acre-ft) |
Surface Area (acres) |
|---|---|---|---|---|---|---|---|---|
| Abilene |

|
12.5 | 1,994.04 | -18.26 | 987 | 987 | 7,900 | 172 |
| Alan Henry |
|
77.3 | 2,211.26 | -8.74 | 74,322 | 74,322 | 96,207 | 2,250 |
| Champion Creek |
|
38.4 | 2,060.68 | -22.32 | 15,981 | 15,981 | 41,580 | 814 |
| Coleman |
|
85.7 | 1,714.42 | -3.08 | 32,666 | 32,648 | 38,075 | 1,706 |
| Colorado City |
|
51.1 | 2,058.20 | -12.00 | 15,705 | 15,705 | 30,758 | - n.a. - |
| Fort Phantom Hill |
|
76.7 | 1,631.33 | -4.57 | 53,743 | 53,737 | 70,030 | 3,220 |
| Greenbelt |
|
5.9 | 2,609.61 | -54.39 | 3,970 | 3,538 | 59,968 | 317 |
| Hords Creek |

|
52.0 | 1,890.20 | -9.80 | 4,217 | 4,214 | 8,109 | 301 |
| J B Thomas |
|
23.2 | 2,228.06 | -29.94 | 47,019 | 46,346 | 199,931 | 3,280 |
| Kemp |
|
84.2 | 1,141.98 | -2.02 | 206,745 | 206,619 | 245,307 | 11,687 |
| Millers Creek |
|
63.0 | 1,328.61 | -5.39 | 18,153 | 16,870 | 26,768 | 1,475 |
| North Fork Buffalo Creek |
|
88.2 | 1,046.85 | -1.15 | 13,576 | 13,576 | 15,400 | 1,390 |
| Stamford |
|
71.1 | 1,413.76 | -3.04 | 36,683 | 36,680 | 51,570 | 3,984 |
| Sweetwater |
|
20.0 | 2,092.46 | -24.04 | 2,457 | 2,457 | 12,267 | 227 |