Trinity River Basin Reservoirs: Monitored Water Supply Reservoirs are 96.3% full on 2026-07-17
Historical Data
| Date | Percent Full |
Reservoir Storage (acre-ft) |
Conservation Storage (acre-ft) |
Conservation Capacity (acre-ft) |
|
|---|---|---|---|---|---|
| Today | 2026-07-17 | 96.3 | 6,633,434 | 6,526,493 | 6,776,855 |
| Yesterday | 2026-07-16 | 96.3 | 6,641,644 | 6,525,730 | 6,776,855 |
| 2 days ago | 2026-07-15 | 96.3 | 6,648,795 | 6,524,220 | 6,776,855 |
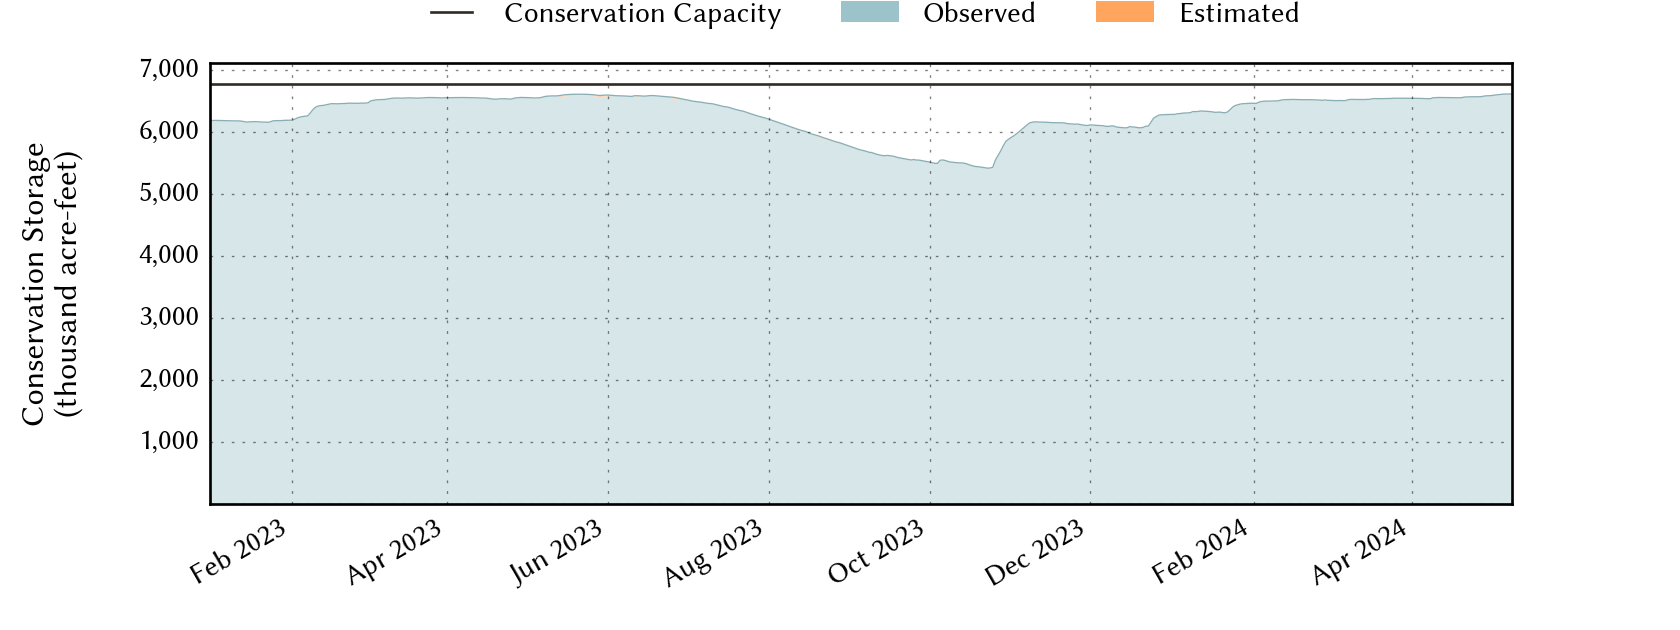
| 1 week ago | 2026-07-10 | 95.9 | 6,597,343 | 6,499,811 | 6,776,855 |
| 1 month ago | 2026-06-17 | 96.9 | 6,836,931 | 6,567,612 | 6,776,855 |
| 3 months ago | 2026-04-17 | 95.5 | 6,600,309 | 6,472,021 | 6,776,855 |
| 6 months ago | 2026-01-17 | 93.0 | 6,382,535 | 6,303,294 | 6,776,855 |
| 1 year ago | 2025-07-17 | 99.6 | 6,908,669 | 6,750,929 | 6,776,855 |
*
Percent Full is based on Conservation Storage and Conservation Capacity and doesn't account for storage in flood pool.
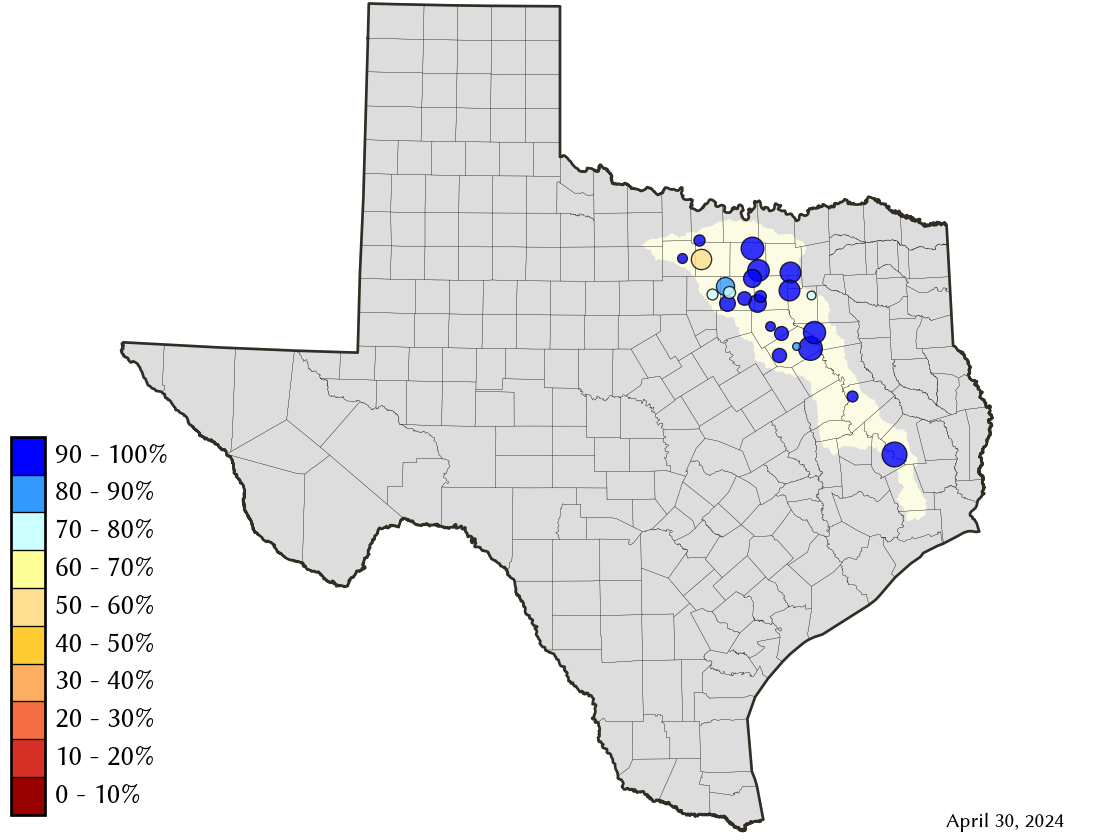
Area Map
Reservoir Storage
| Reservoir | Type | Percent Full |
Water Level (ft) |
Height Above Conservation Pool (ft) |
Reservoir Storage (acre-ft) |
Conservation Storage (acre-ft) |
Conservation Capacity (acre-ft) |
Surface Area (acres) |
|---|---|---|---|---|---|---|---|---|
| Amon G Carter |

|
86.5 | 918.15 | -1.85 | 17,448 | 16,664 | 19,266 | 1,350 |
| Arlington |
|
93.0 | 548.52 | -1.48 | 37,370 | 37,338 | 40,157 | 1,887 |
| Bardwell |

|
100.0 | 421.06 | 0.06 | 44,117 | 43,856 | 43,856 | 3,312 |
| Benbrook |
|
94.1 | 692.59 | -1.41 | 80,585 | 80,585 | 85,648 | 3,512 |
| Bridgeport |
|
85.9 | 831.54 | -4.46 | 319,710 | 319,710 | 372,183 | 11,280 |
| Cedar Creek |
|
83.9 | 318.66 | -3.34 | 541,124 | 541,025 | 644,686 | 29,549 |
| Eagle Mountain |
|
86.3 | 646.21 | -2.89 | 159,705 | 159,705 | 185,087 | 8,369 |
| Grapevine |
|
100.0 | 535.29 | 0.29 | 164,987 | 163,064 | 163,064 | - n.a. - |
| Halbert |
|
83.7 | 366.23 | -1.77 | 5,047 | 5,047 | 6,033 | 537 |
| Houston County |
|
100.0 | 260.08 | 0.08 | 17,769 | 17,113 | 17,113 | - n.a. - |
| Joe Pool |
|
100.0 | 522.00 | 0.00 | 150,999 | 149,629 | 149,629 | 6,680 |
| Lavon |
|
100.0 | 492.07 | 0.07 | 414,043 | 409,757 | 409,757 | 20,658 |
| Lewisville |
|
100.0 | 522.16 | 0.16 | 603,232 | 563,228 | 563,228 | - n.a. - |
| Livingston |
|
100.0 | 131.20 | 0.20 | 1,619,147 | 1,603,504 | 1,603,504 | - n.a. - |
| Lost Creek |
|
93.7 | 1,007.62 | -1.88 | 11,194 | 11,194 | 11,950 | - n.a. - |
| Mountain Creek |
|
100.0 | 457.60 | 0.60 | 24,411 | 22,850 | 22,850 | 2,855 |
| Navarro Mills |
|
96.3 | 424.11 | -0.39 | 48,008 | 48,007 | 49,827 | 4,625 |
| New Terrell City |
|
31.3 | 494.98 | -9.02 | 2,696 | 2,685 | 8,583 | 416 |
| Ray Hubbard |
|
98.7 | 435.23 | -0.27 | 433,949 | 433,949 | 439,559 | 20,631 |
| Ray Roberts |
|
100.0 | 632.66 | 0.16 | 793,036 | 788,167 | 788,167 | - n.a. - |
| Richland-Chambers |
|
97.1 | 314.27 | -0.73 | 1,093,385 | 1,067,602 | 1,099,417 | 43,291 |
| Waxahachie |
|
97.6 | 531.10 | -0.40 | 11,381 | 10,799 | 11,060 | 650 |
| Weatherford |
|
65.3 | 889.75 | -6.25 | 11,636 | 11,636 | 17,812 | 906 |
| Worth |
|
79.4 | 592.49 | -1.51 | 28,455 | 19,379 | 24,419 | 3,248 |