San Angelo Area Reservoirs: Monitored Water Supply Reservoirs are 34.5% full on 2026-07-23
Historical Data
| Date | Percent Full |
Reservoir Storage (acre-ft) |
Conservation Storage (acre-ft) |
Conservation Capacity (acre-ft) |
|
|---|---|---|---|---|---|
| Today | 2026-07-23 | 34.5 | 301,394 | 297,151 | 862,151 |
| Yesterday | 2026-07-22 | 34.5 | 301,703 | 297,460 | 862,151 |
| 2 days ago | 2026-07-21 | 34.6 | 302,141 | 297,898 | 862,151 |
| 1 week ago | 2026-07-16 | 34.3 | 299,663 | 295,420 | 862,151 |
| 1 month ago | 2026-06-23 | 35.8 | 312,497 | 308,254 | 862,151 |
| 3 months ago | 2026-04-23 | 35.4 | 309,382 | 305,139 | 862,151 |
| 6 months ago | 2026-01-23 | 35.3 | 308,907 | 304,664 | 862,151 |
| 1 year ago | 2025-07-23 | 41.9 | 365,388 | 361,145 | 862,151 |
*
Percent Full is based on Conservation Storage and Conservation Capacity and doesn't account for storage in flood pool.
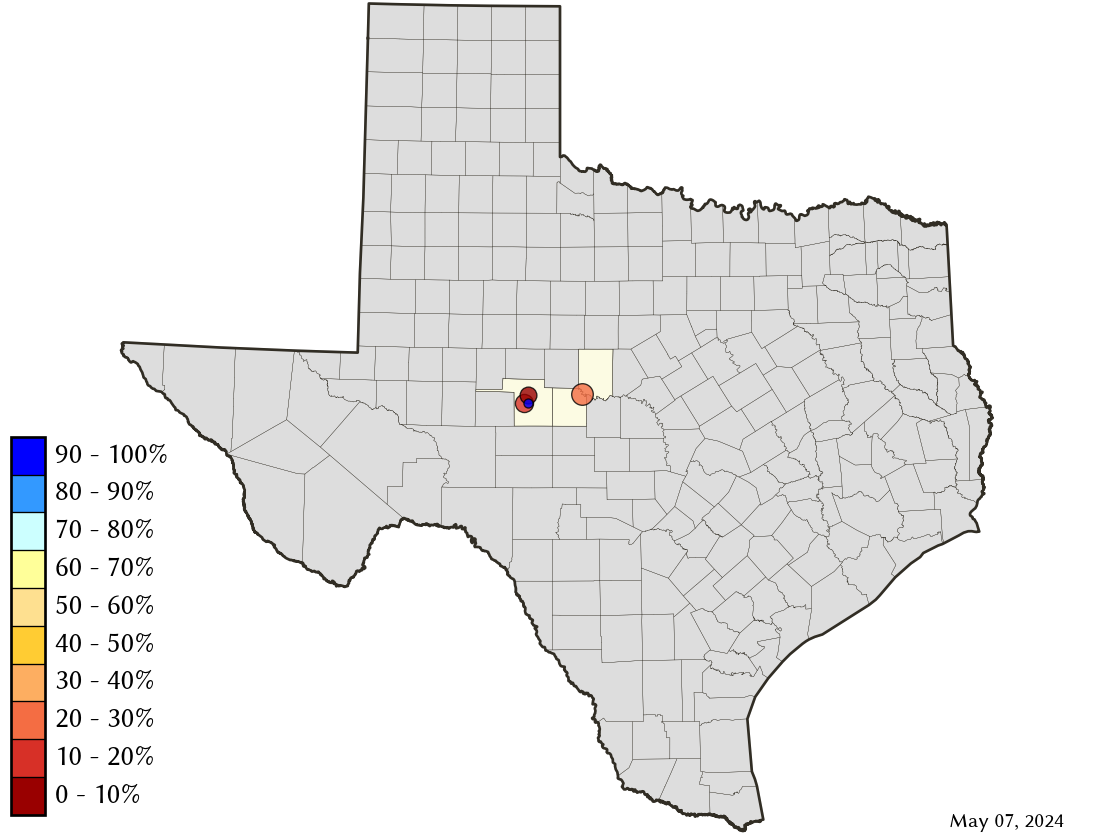
Area Map
Reservoir Storage
| Reservoir | Type | Percent Full |
Water Level (ft) |
Height Above Conservation Pool (ft) |
Reservoir Storage (acre-ft) |
Conservation Storage (acre-ft) |
Conservation Capacity (acre-ft) |
Surface Area (acres) |
|---|---|---|---|---|---|---|---|---|
| Nasworthy |

|
86.0 | 1,871.76 | -0.95 | 8,762 | 8,269 | 9,615 | 1,236 |
| O C Fisher |

|
12.8 | 1,874.22 | -33.78 | 14,836 | 14,835 | 115,742 | 1,245 |
| O H Ivie |
|
46.8 | 1,532.05 | -19.45 | 259,365 | 259,365 | 554,340 | - n.a. - |
| Twin Buttes |
|
8.0 | 1,900.07 | -40.13 | 18,431 | 14,682 | 182,454 | 1,360 |