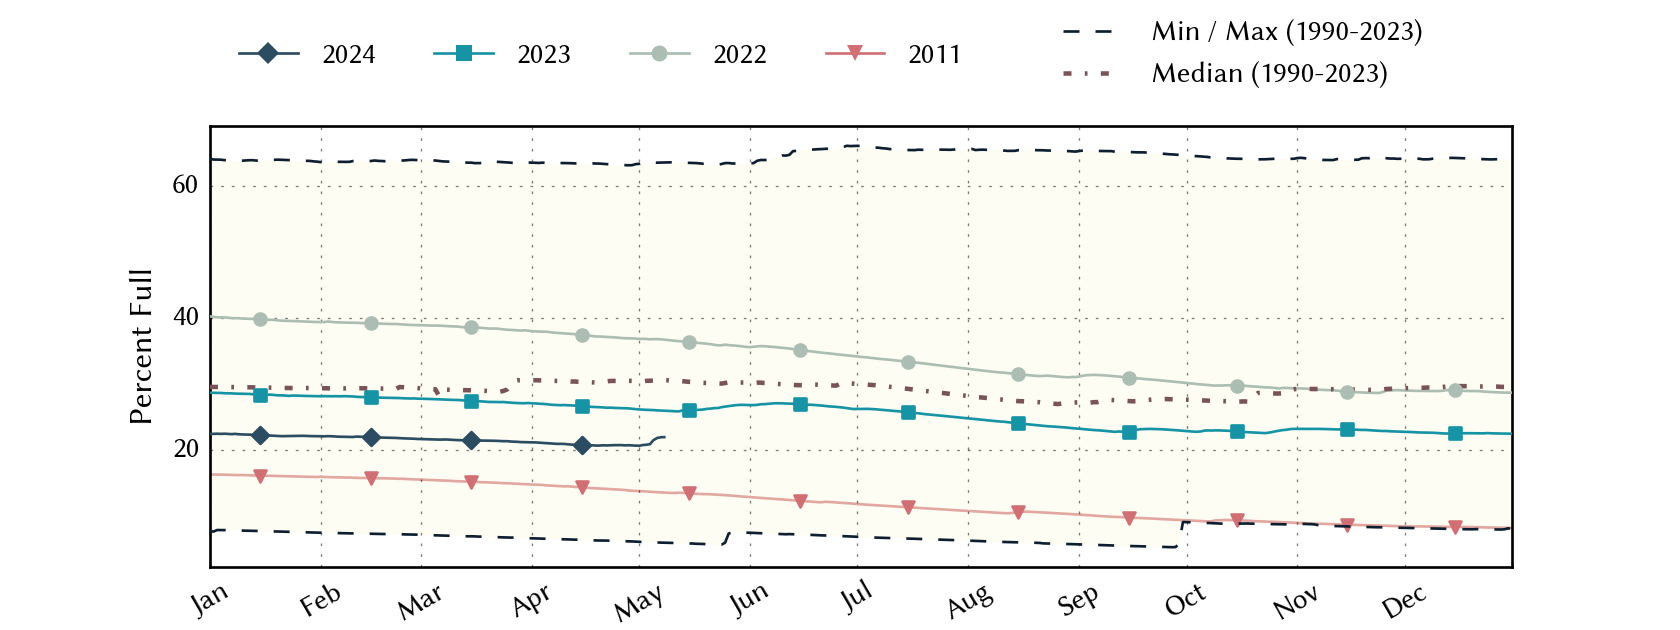
Midland Odessa Area Reservoirs: Monitored Water Supply Reservoirs are 28.7% full on 2026-07-23
Historical Data
| Date | Percent Full |
Reservoir Storage (acre-ft) |
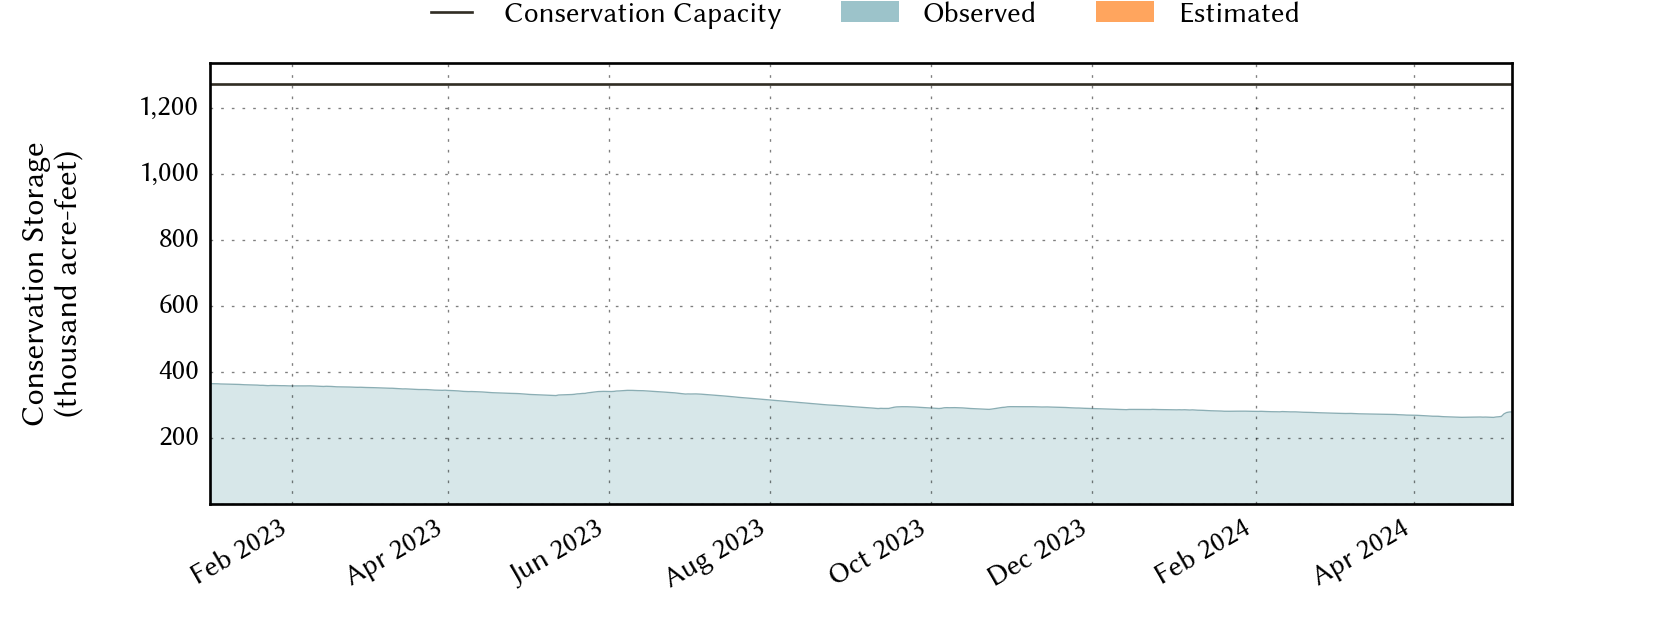
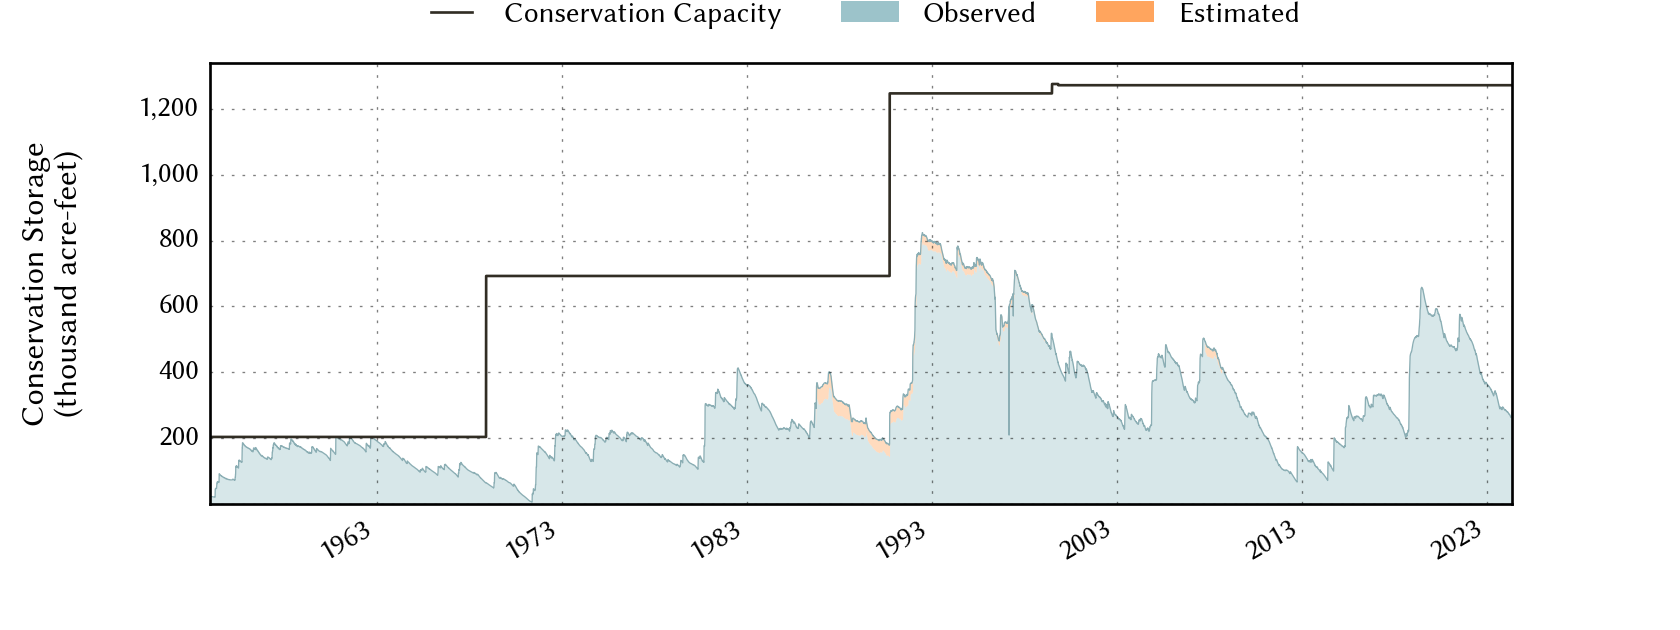
Conservation Storage (acre-ft) |
Conservation Capacity (acre-ft) |
|
|---|---|---|---|---|---|
| Today | 2026-07-23 | 28.7 | 365,027 | 364,354 | 1,271,543 |
| Yesterday | 2026-07-22 | 28.7 | 365,114 | 364,441 | 1,271,543 |
| 2 days ago | 2026-07-21 | 28.6 | 364,782 | 364,109 | 1,271,543 |
| 1 week ago | 2026-07-16 | 28.1 | 358,547 | 357,874 | 1,271,543 |
| 1 month ago | 2026-06-23 | 29.4 | 374,328 | 373,655 | 1,271,543 |
| 3 months ago | 2026-04-23 | 29.4 | 374,783 | 374,110 | 1,271,543 |
| 6 months ago | 2026-01-23 | 29.9 | 380,798 | 380,125 | 1,271,543 |
| 1 year ago | 2025-07-23 | 36.0 | 457,998 | 457,325 | 1,271,543 |
*
Percent Full is based on Conservation Storage and Conservation Capacity and doesn't account for storage in flood pool.
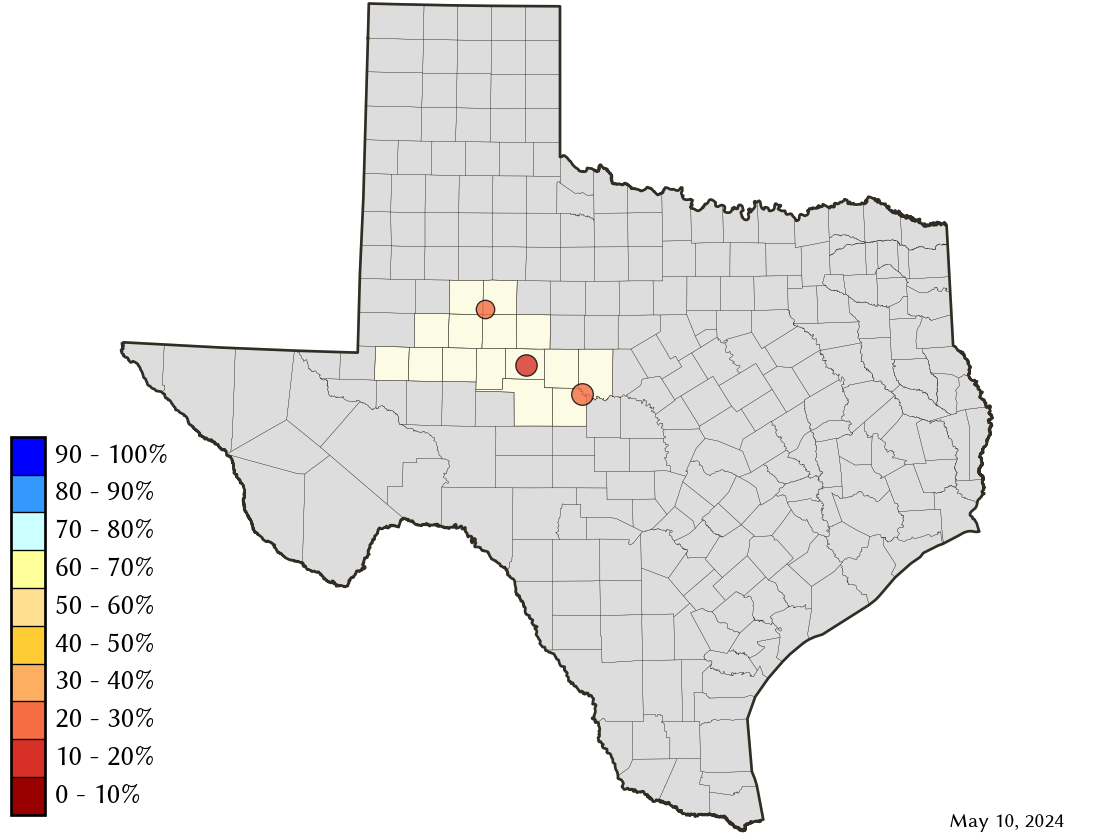
Area Map
Reservoir Storage
| Reservoir | Type | Percent Full |
Water Level (ft) |
Height Above Conservation Pool (ft) |
Reservoir Storage (acre-ft) |
Conservation Storage (acre-ft) |
Conservation Capacity (acre-ft) |
Surface Area (acres) |
|---|---|---|---|---|---|---|---|---|
| E V Spence |

|
10.9 | 1,844.50 | -53.50 | 56,357 | 56,357 | 517,272 | 3,585 |
| J B Thomas |
|
24.3 | 2,228.75 | -29.25 | 49,305 | 48,632 | 199,931 | 3,350 |
| O H Ivie |
|
46.8 | 1,532.05 | -19.45 | 259,365 | 259,365 | 554,340 | - n.a. - |