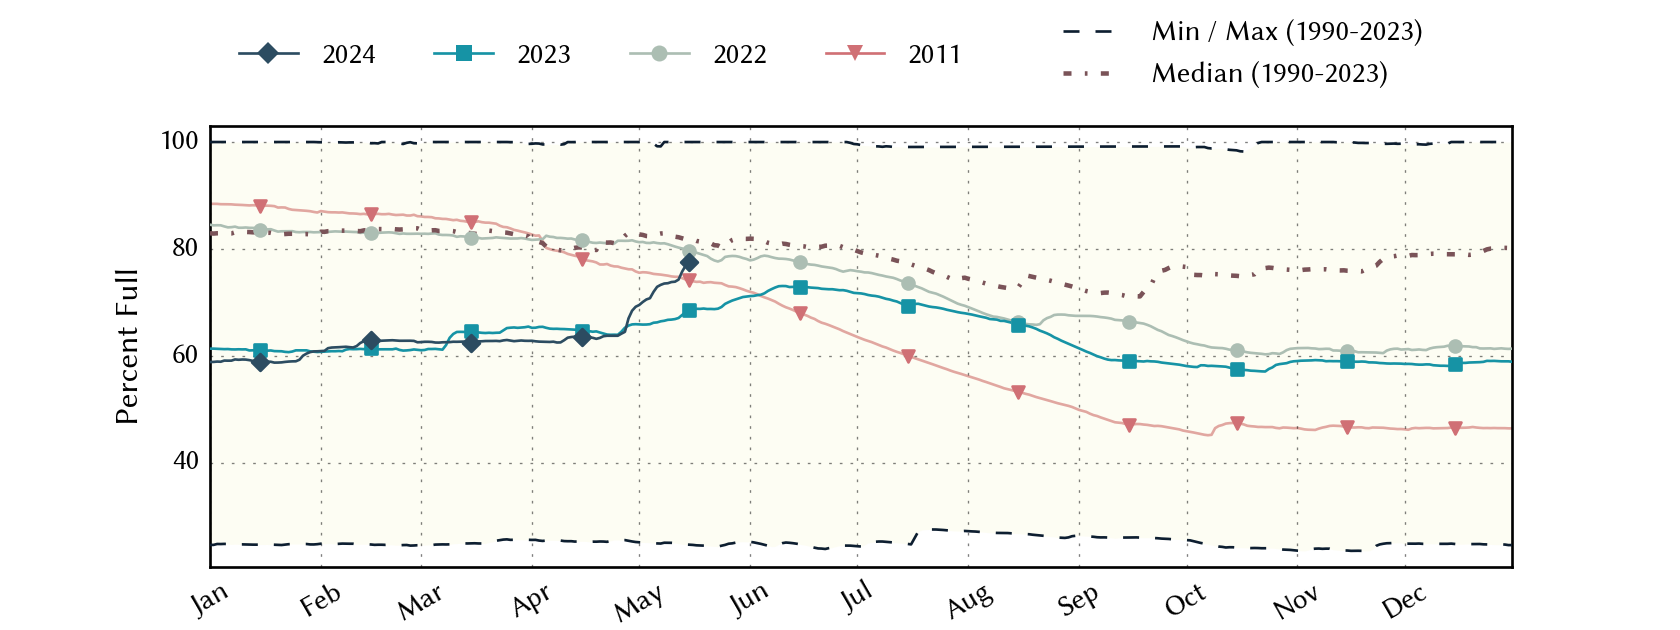
Region-B Planning Region Reservoirs: Monitored Water Supply Reservoirs are 82.8% full on 2026-07-23
Historical Data
| Date | Percent Full |
Reservoir Storage (acre-ft) |
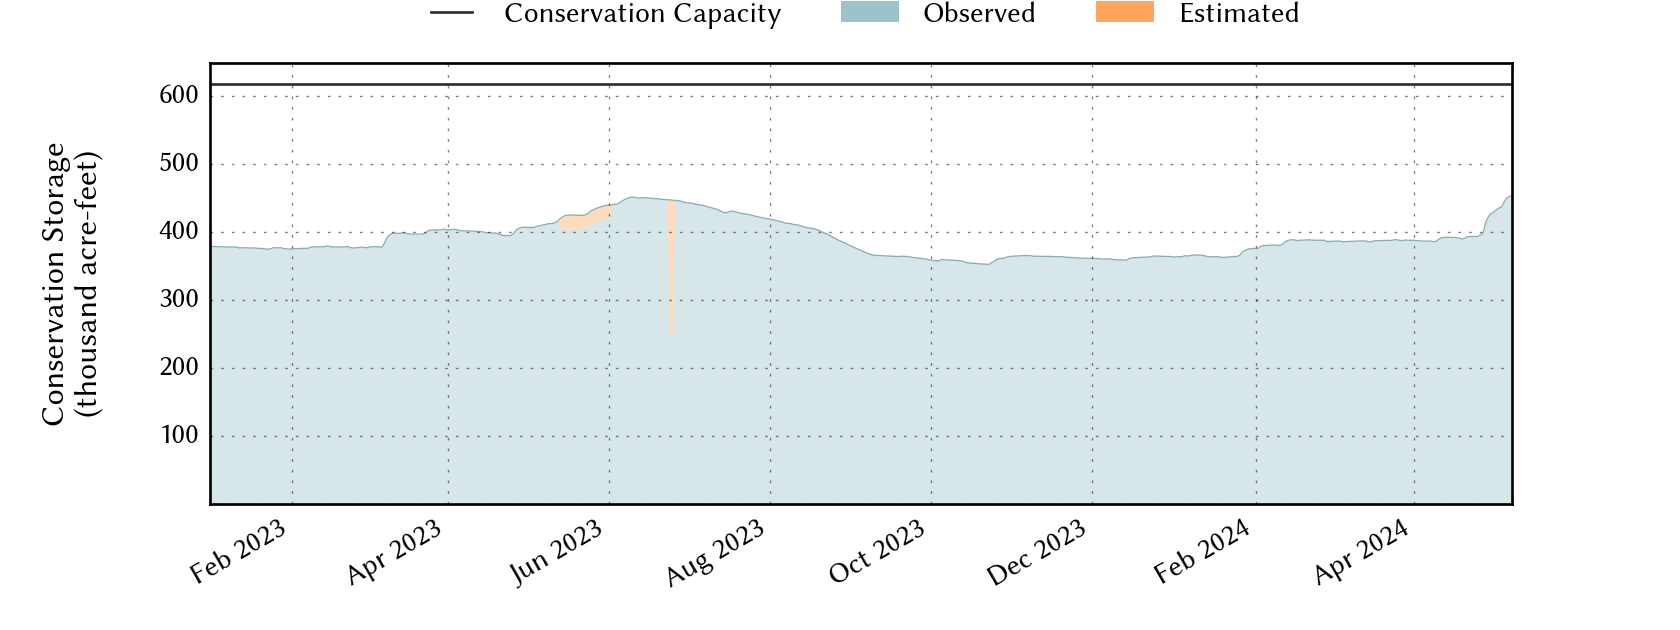
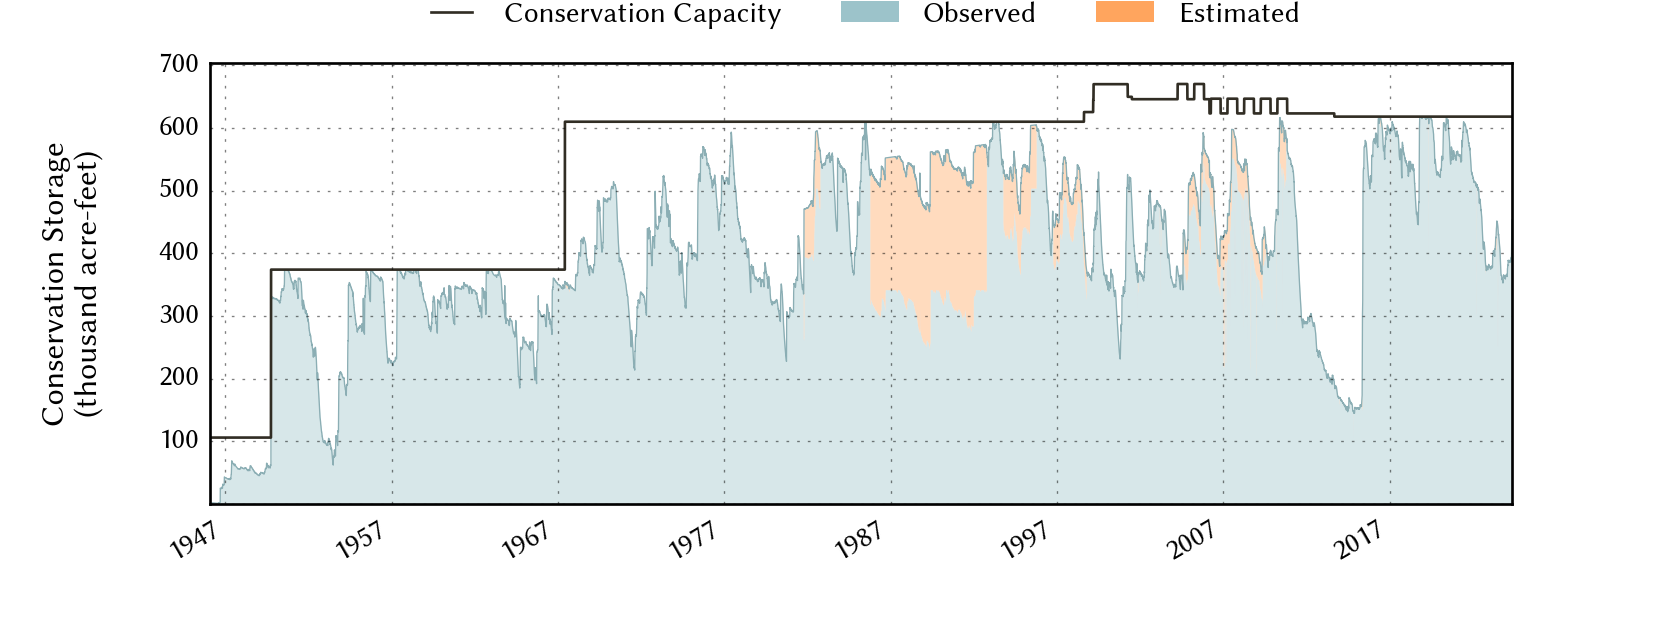
Conservation Storage (acre-ft) |
Conservation Capacity (acre-ft) |
|
|---|---|---|---|---|---|
| Today | 2026-07-23 | 82.8 | 512,799 | 511,585 | 618,121 |
| Yesterday | 2026-07-22 | 82.9 | 513,757 | 512,543 | 618,121 |
| 2 days ago | 2026-07-21 | 83.0 | 514,508 | 513,294 | 618,121 |
| 1 week ago | 2026-07-16 | 83.2 | 515,495 | 514,281 | 618,121 |
| 1 month ago | 2026-06-23 | 90.5 | 560,837 | 559,623 | 618,121 |
| 3 months ago | 2026-04-23 | 89.9 | 556,816 | 555,602 | 618,121 |
| 6 months ago | 2026-01-23 | 88.7 | 549,759 | 548,545 | 618,121 |
| 1 year ago | 2025-07-23 | 98.3 | 649,121 | 607,812 | 618,121 |
*
Percent Full is based on Conservation Storage and Conservation Capacity and doesn't account for storage in flood pool.
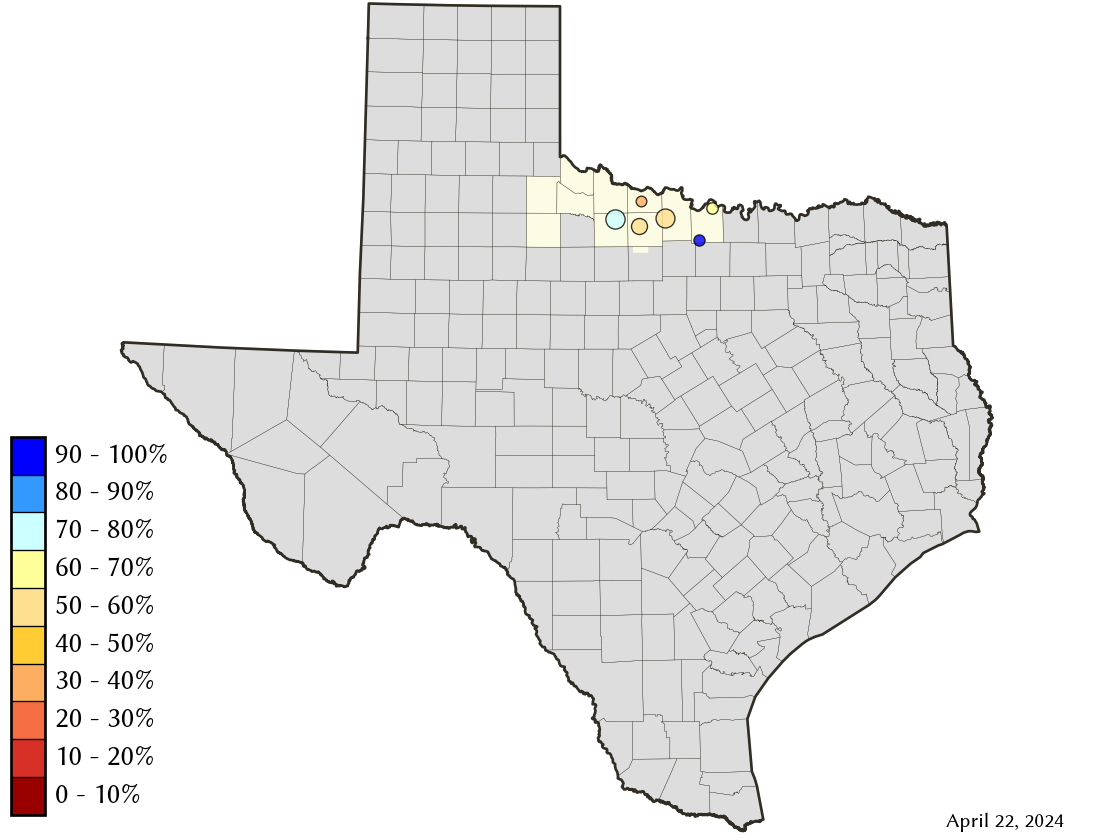
Area Map
Reservoir Storage
| Reservoir | Type | Percent Full |
Water Level (ft) |
Height Above Conservation Pool (ft) |
Reservoir Storage (acre-ft) |
Conservation Storage (acre-ft) |
Conservation Capacity (acre-ft) |
Surface Area (acres) |
|---|---|---|---|---|---|---|---|---|
| Amon G Carter |

|
85.6 | 918.03 | -1.97 | 17,283 | 16,499 | 19,266 | 1,341 |
| Arrowhead |
|
79.7 | 922.56 | -3.44 | 183,511 | 183,511 | 230,359 | 12,732 |
| Kemp |

|
83.7 | 1,141.87 | -2.13 | 205,465 | 205,339 | 245,307 | 11,590 |
| Kickapoo |
|
87.3 | 1,043.06 | -1.94 | 75,397 | 75,397 | 86,345 | 5,423 |
| Nocona |
|
81.0 | 824.33 | -3.17 | 17,680 | 17,376 | 21,444 | 1,224 |
| North Fork Buffalo Creek |
|
87.4 | 1,046.78 | -1.22 | 13,463 | 13,463 | 15,400 | 1,382 |