Lower-Colorado Planning Region Reservoirs: Monitored Water Supply Reservoirs are 99.5% full on 2026-08-02
Historical Data
| Date | Percent Full |
Reservoir Storage (acre-ft) |
Conservation Storage (acre-ft) |
Conservation Capacity (acre-ft) |
|
|---|---|---|---|---|---|
| Most recent | 2026-08-02 | 99.5 | 2,163,666 | 2,113,240 | 2,122,814 |
| 1 day prior | 2026-08-01 | 99.5 | 2,164,071 | 2,112,692 | 2,122,814 |
| 2 days prior | 2026-07-31 | 99.5 | 2,164,123 | 2,112,172 | 2,122,814 |
| 1 week prior | 2026-07-26 | 99.6 | 2,171,211 | 2,113,531 | 2,122,814 |
| 1 month prior | 2026-07-02 | 92.1 | 2,005,962 | 1,955,536 | 2,122,814 |
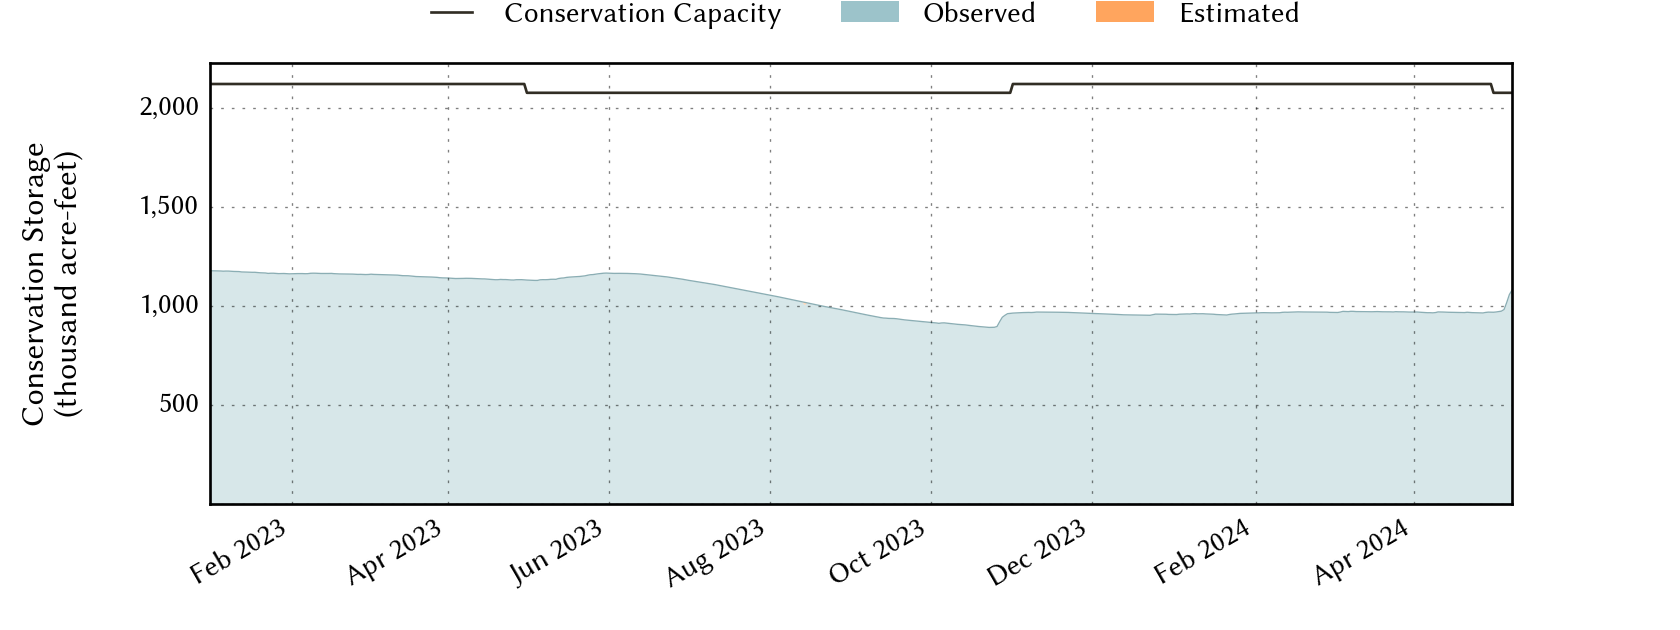
| 3 months prior | 2026-05-02 | 84.9 | 1,852,284 | 1,801,858 | 2,122,814 |
| 6 months prior | 2026-02-02 | 85.8 | 1,872,085 | 1,821,659 | 2,122,814 |
| 1 year prior | 2025-08-02 | 94.8 | 2,062,595 | 2,012,169 | 2,122,814 |
*
Percent Full is based on Conservation Storage and Conservation Capacity and doesn't account for storage in flood pool.
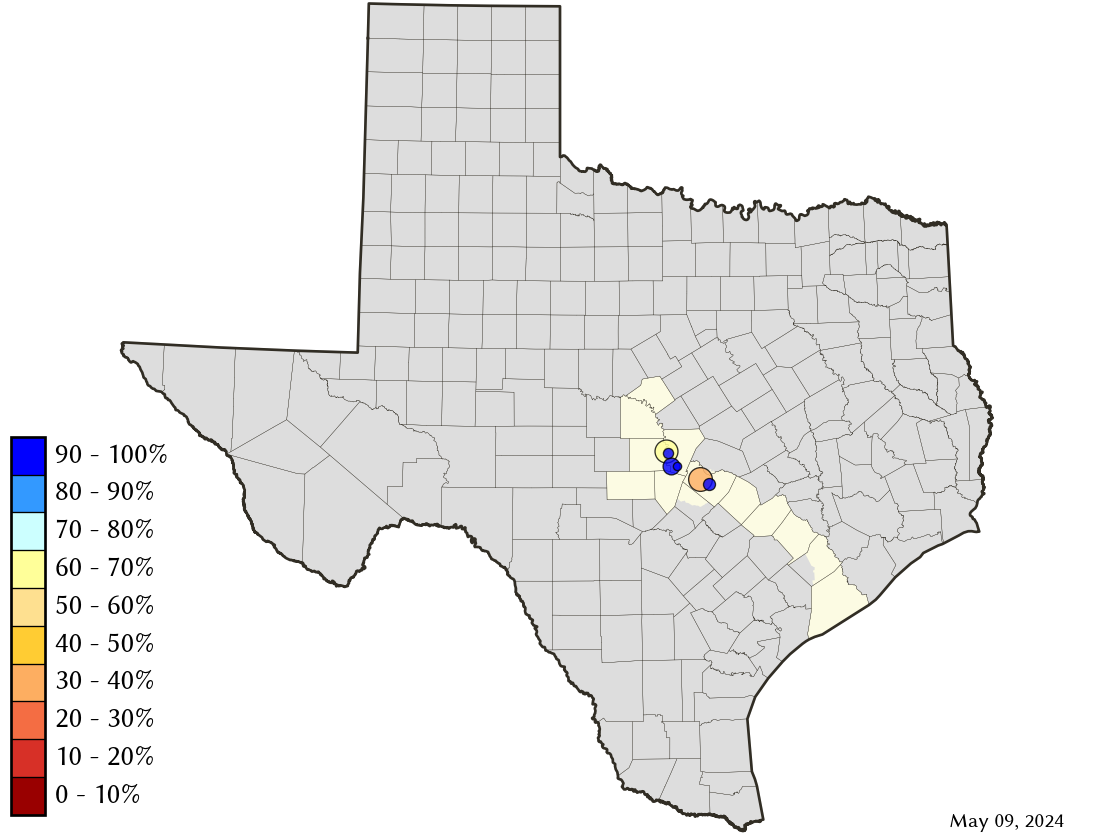
Area Map
Reservoir Storage
| Reservoir | Type | Percent Full |
Water Level (ft) |
Height Above Conservation Pool (ft) |
Reservoir Storage (acre-ft) |
Conservation Storage (acre-ft) |
Conservation Capacity (acre-ft) |
Surface Area (acres) |
|---|---|---|---|---|---|---|---|---|
| Austin |

|
97.1 | 492.36 | -0.44 | 23,891 | 23,282 | 23,972 | 1,554 |
| Buchanan |
|
99.4 | 1,019.76 | -0.24 | 874,975 | 861,313 | 866,694 | 22,396 |
| Inks |
|
94.6 | 887.06 | -0.94 | 13,265 | 12,982 | 13,729 | 779 |
| Lyndon B Johnson |
|
97.9 | 824.63 | -0.37 | 129,244 | 110,404 | 112,778 | 6,397 |
| Marble Falls |
|
95.0 | 736.37 | -0.63 | 7,215 | 7,215 | 7,597 | 601 |
| Travis |

|
100.0 | 681.00 | 0.00 | 1,115,076 | 1,098,044 | 1,098,044 | 19,044 |