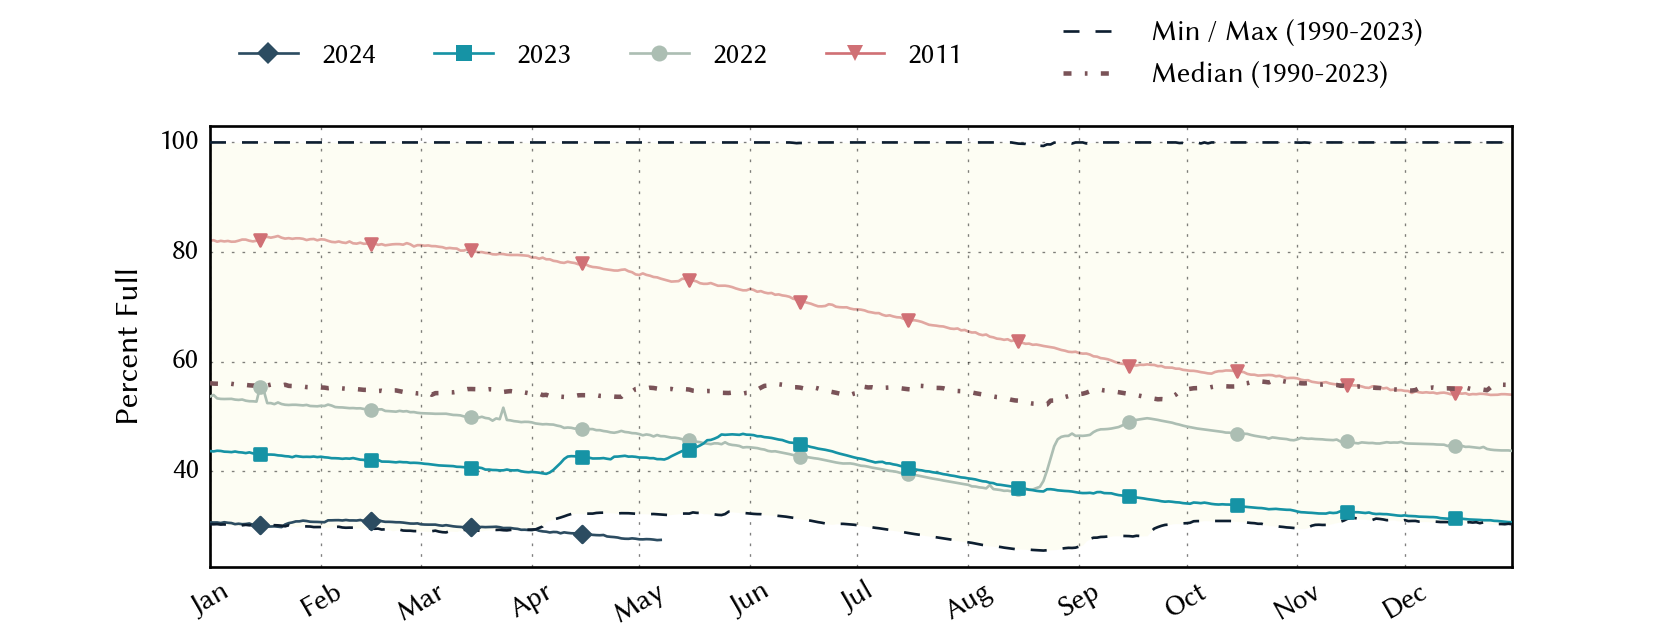
Coastal-Bend Planning Region Reservoirs: Monitored Water Supply Reservoirs are 33.5% full on 2026-08-03
Historical Data
| Date | Percent Full |
Reservoir Storage (acre-ft) |
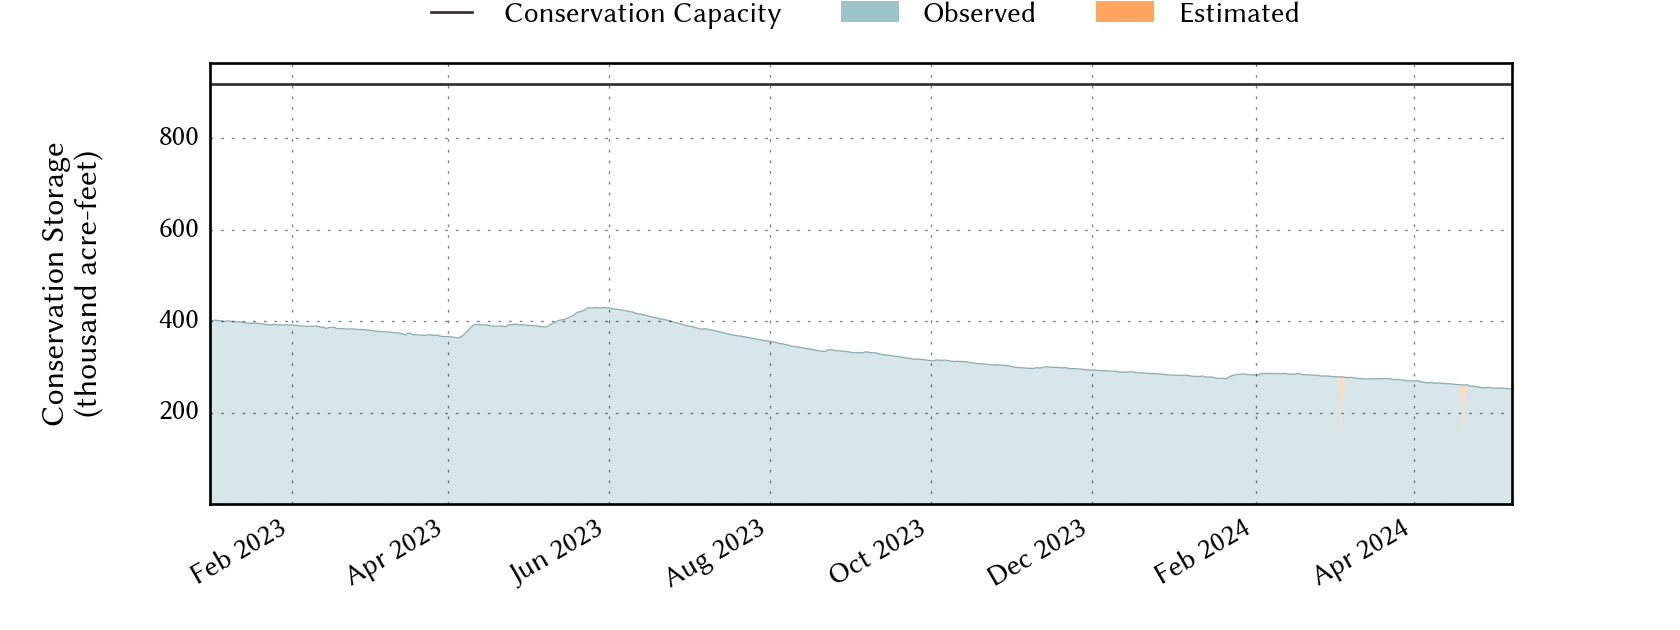
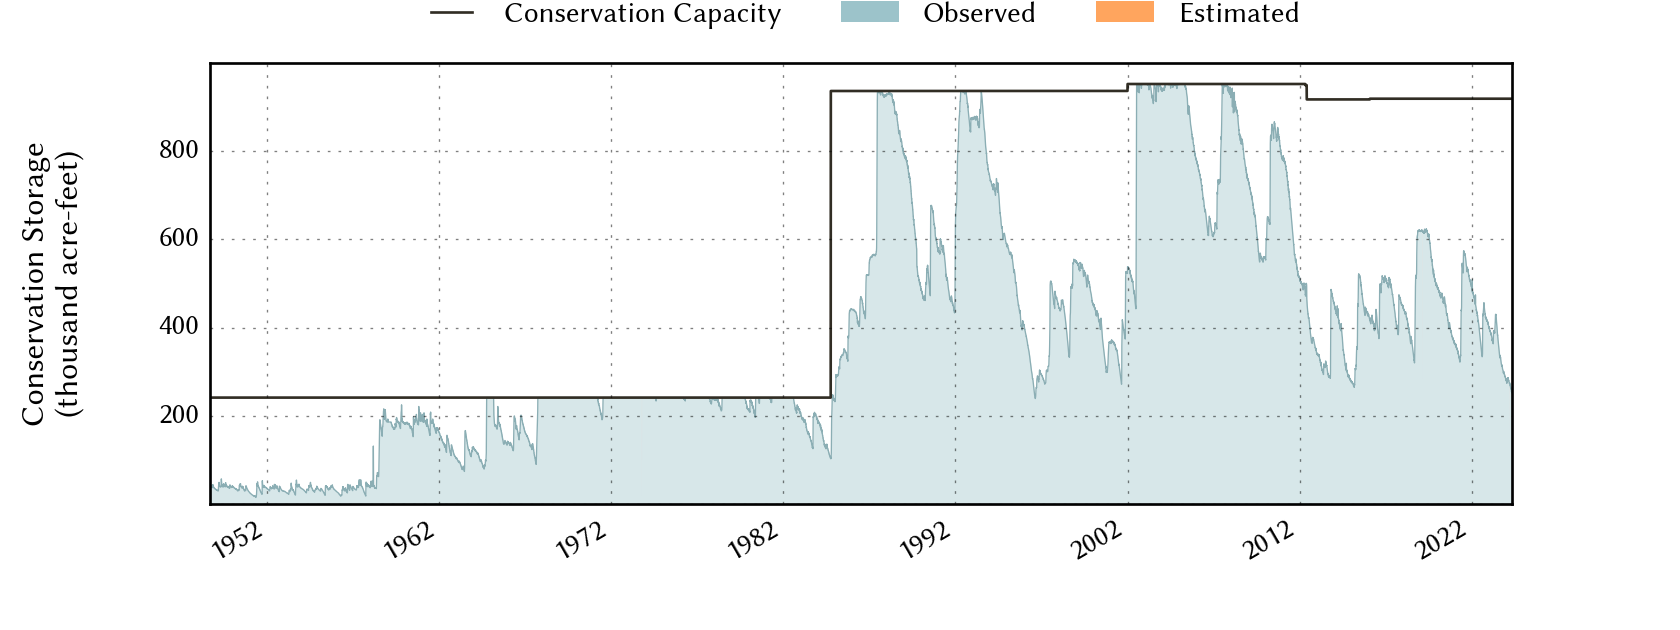
Conservation Storage (acre-ft) |
Conservation Capacity (acre-ft) |
|
|---|---|---|---|---|---|
| Today | 2026-08-03 | 33.5 | 308,381 | 308,102 | 918,882 |
| Yesterday | 2026-08-02 | 32.3 | 297,264 | 296,985 | 918,882 |
| 2 days ago | 2026-08-01 | 30.2 | 277,543 | 277,264 | 918,882 |
| 1 week ago | 2026-07-27 | 26.3 | 242,186 | 241,907 | 918,882 |
| 1 month ago | 2026-07-03 | 15.8 | 145,317 | 145,038 | 918,882 |
| 3 months ago | 2026-05-03 | 7.6 | 70,480 | 70,201 | 918,882 |
| 6 months ago | 2026-02-03 | 9.5 | 87,464 | 87,185 | 918,882 |
| 1 year ago | 2025-08-03 | 14.7 | 135,444 | 135,165 | 918,882 |
*
Percent Full is based on Conservation Storage and Conservation Capacity and doesn't account for storage in flood pool.
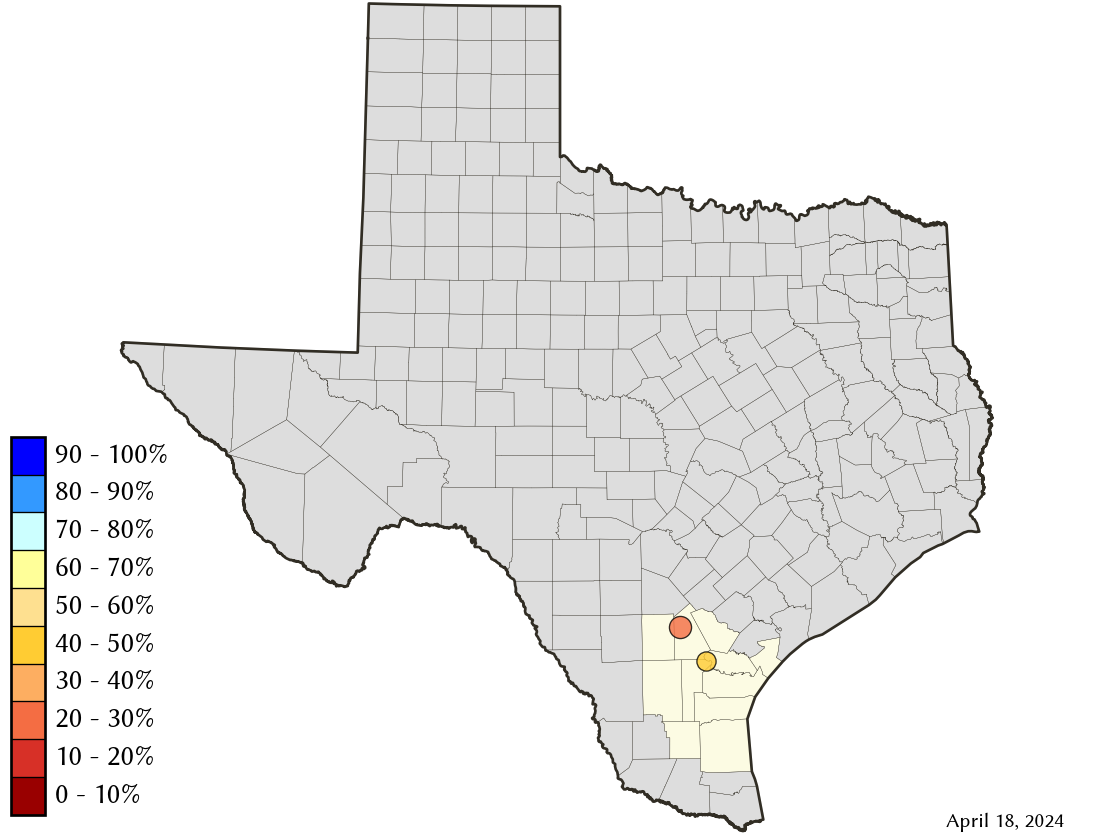
Area Map
Reservoir Storage
| Reservoir | Type | Percent Full |
Water Level (ft) |
Height Above Conservation Pool (ft) |
Reservoir Storage (acre-ft) |
Conservation Storage (acre-ft) |
Conservation Capacity (acre-ft) |
Surface Area (acres) |
|---|---|---|---|---|---|---|---|---|
| Choke Canyon |

|
24.9 | 192.89 | -27.61 | 165,304 | 165,303 | 662,820 | 11,098 |
| Corpus Christi |
|
55.8 | 87.56 | -6.44 | 143,077 | 142,799 | 256,062 | 15,101 |