Region-C Planning Region Reservoirs: Monitored Water Supply Reservoirs are 95.6% full on 2026-07-25
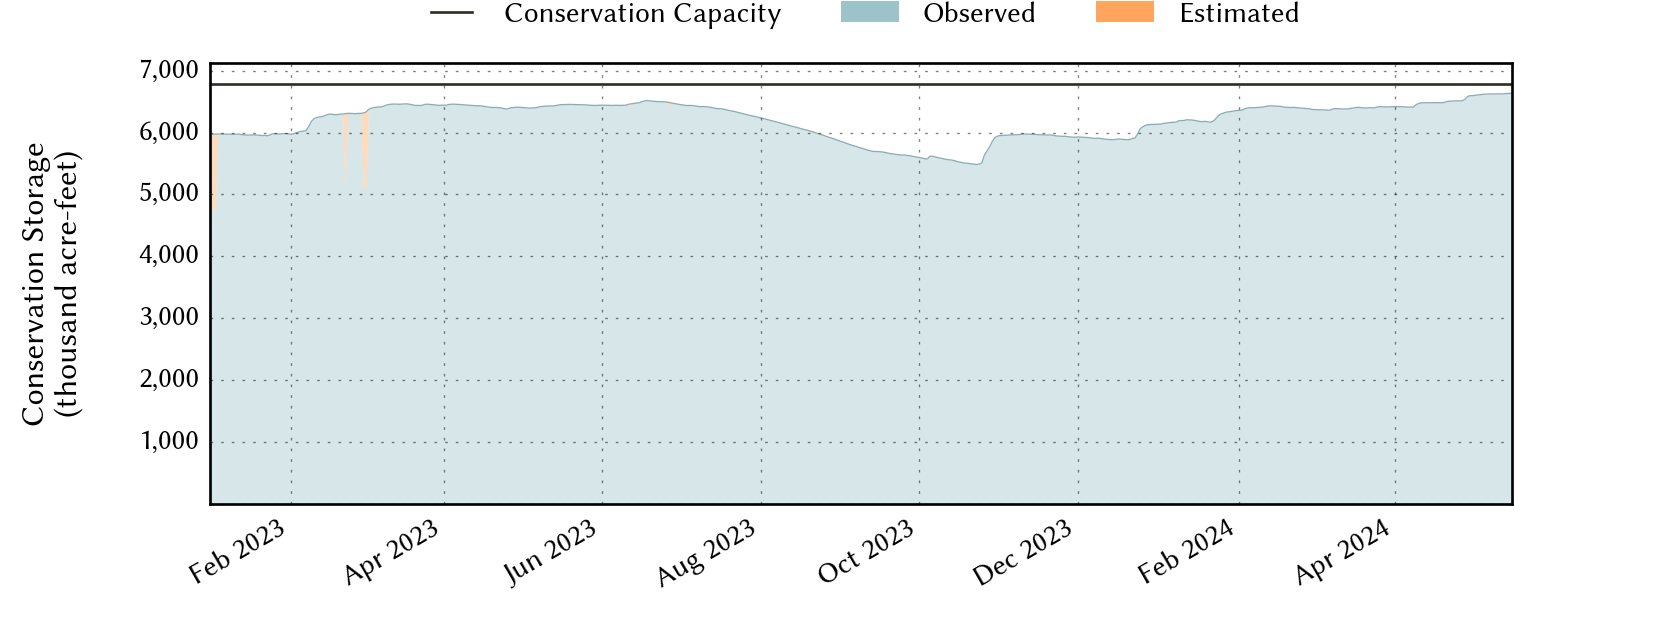
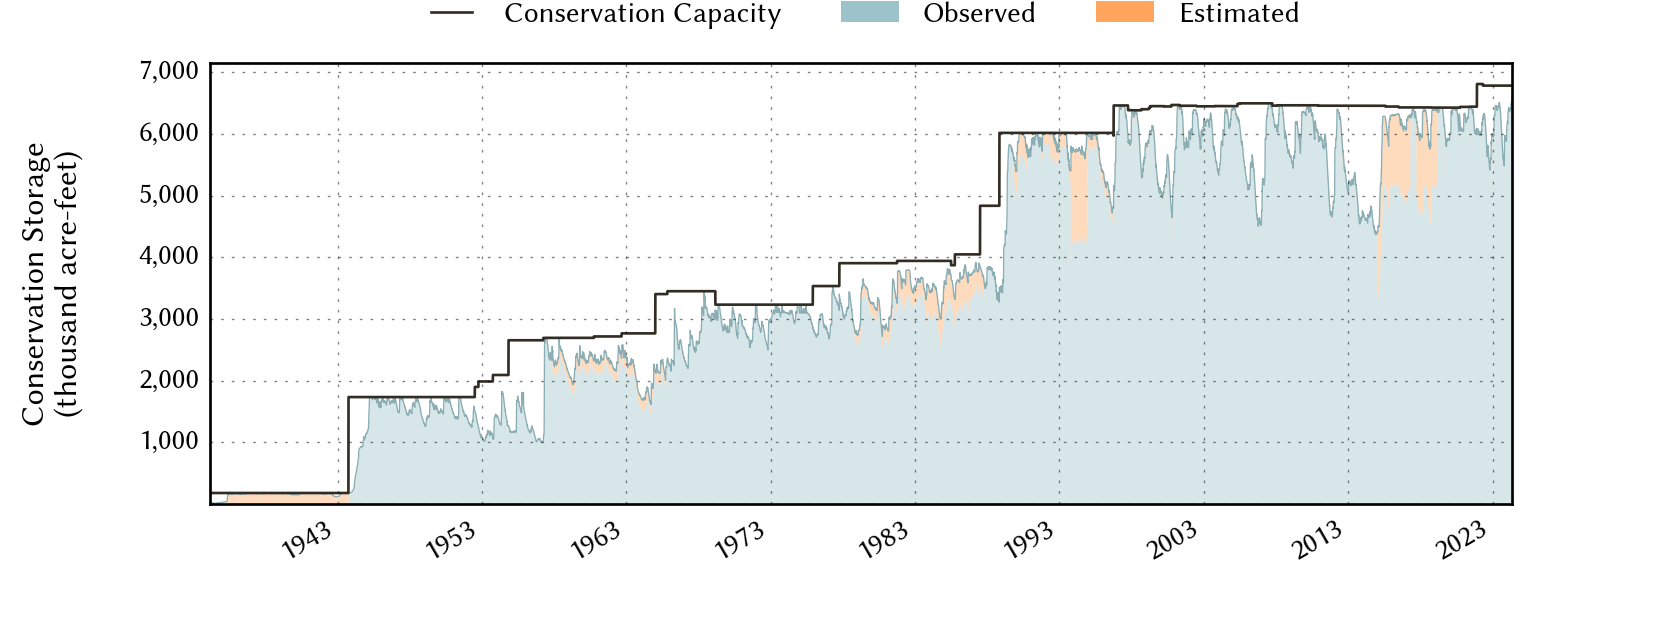
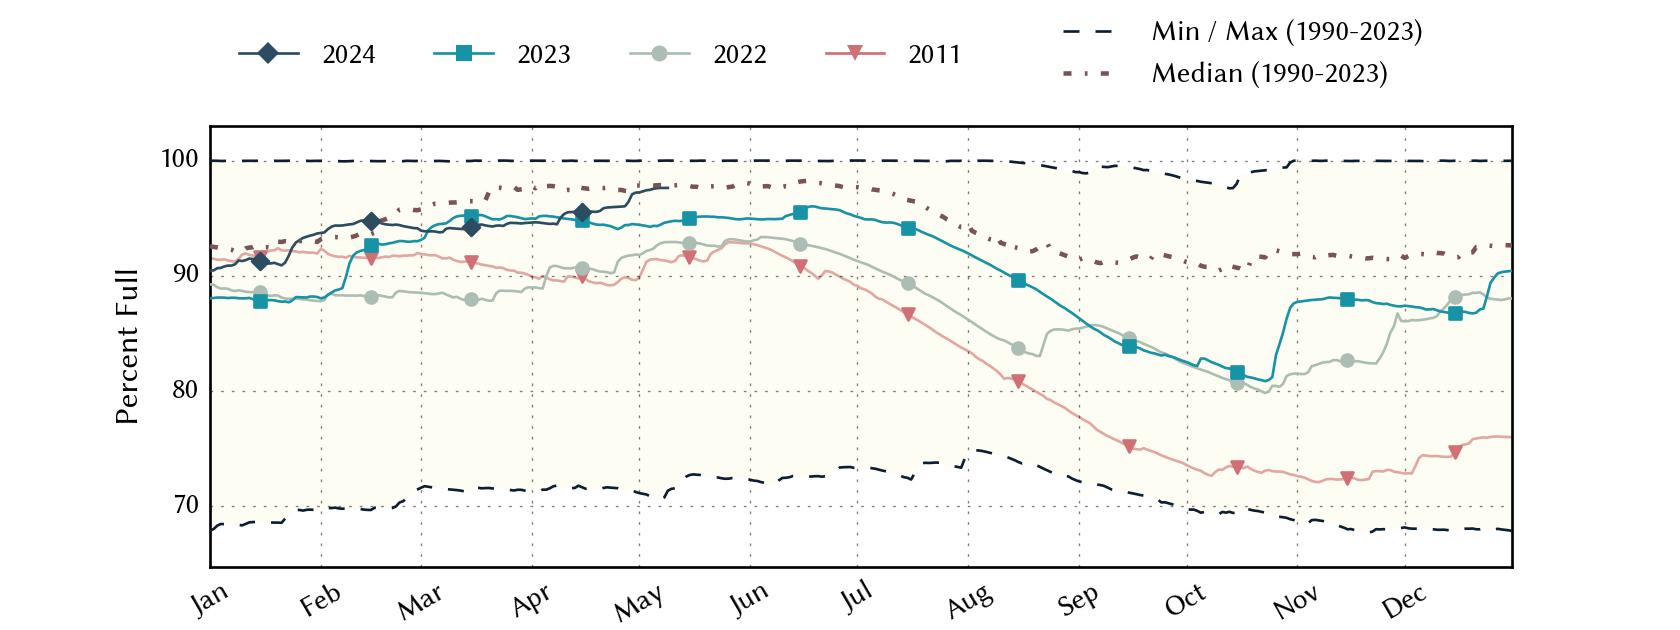
Historical Data
| Date | Percent Full |
Reservoir Storage (acre-ft) |
Conservation Storage (acre-ft) |
Conservation Capacity (acre-ft) |
|
|---|---|---|---|---|---|
| Today | 2026-07-25 | 95.6 | 7,913,468 | 6,483,783 | 6,783,467 |
| Yesterday | 2026-07-24 | 95.7 | 7,922,079 | 6,490,443 | 6,783,467 |
| 2 days ago | 2026-07-23 | 95.8 | 7,936,382 | 6,499,218 | 6,783,467 |
| 1 week ago | 2026-07-18 | 96.3 | 7,988,546 | 6,532,100 | 6,783,467 |
| 1 month ago | 2026-06-25 | 97.0 | 8,230,460 | 6,577,013 | 6,783,467 |
| 3 months ago | 2026-04-25 | 95.0 | 7,810,526 | 6,445,458 | 6,783,467 |
| 6 months ago | 2026-01-25 | 92.7 | 7,601,557 | 6,285,238 | 6,783,467 |
| 1 year ago | 2025-07-25 | 98.9 | 8,154,376 | 6,711,955 | 6,783,467 |
*
Percent Full is based on Conservation Storage and Conservation Capacity and doesn't account for storage in flood pool.
Area Map
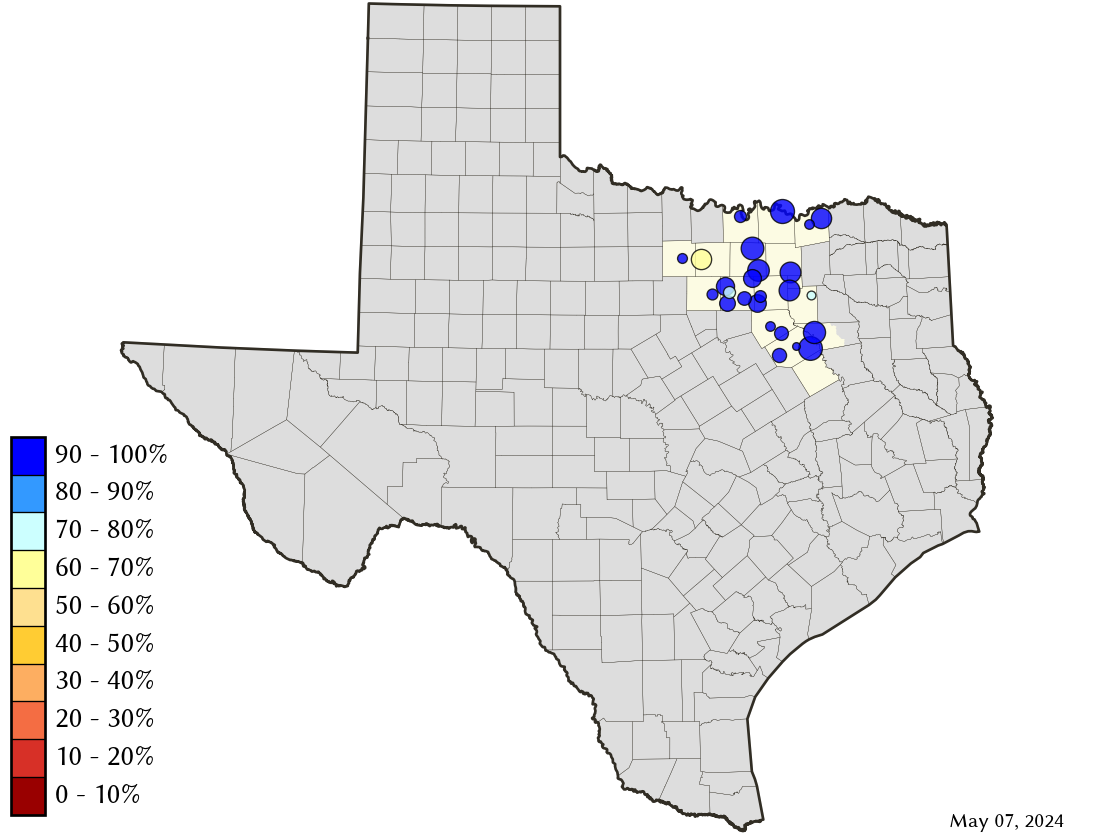
Reservoir Storage
| Reservoir | Type | Percent Full |
Water Level (ft) |
Height Above Conservation Pool (ft) |
Reservoir Storage (acre-ft) |
Conservation Storage (acre-ft) |
Conservation Capacity (acre-ft) |
Surface Area (acres) |
|---|---|---|---|---|---|---|---|---|
| Arlington |

|
88.2 | 547.50 | -2.50 | 35,457 | 35,425 | 40,157 | 1,866 |
| Bardwell |

|
99.3 | 420.91 | -0.09 | 43,621 | 43,560 | 43,856 | 3,281 |
| Benbrook |
|
93.4 | 692.43 | -1.57 | 80,024 | 80,024 | 85,648 | 3,500 |
| Bois d'Arc |
|
98.9 | 533.75 | -0.25 | 363,591 | 363,591 | 367,609 | 16,418 |
| Bonham |
|
94.7 | 564.44 | -0.56 | 10,457 | 10,445 | 11,027 | 1,026 |
| Bridgeport |
|
84.8 | 831.16 | -4.84 | 315,439 | 315,439 | 372,183 | 11,203 |
| Cedar Creek |
|
82.9 | 318.43 | -3.57 | 534,352 | 534,253 | 644,686 | 29,340 |
| Eagle Mountain |
|
85.5 | 646.03 | -3.07 | 158,202 | 158,202 | 185,087 | 8,324 |
| Grapevine |
|
100.0 | 535.10 | 0.10 | 163,724 | 163,064 | 163,064 | - n.a. - |
| Halbert |
|
82.8 | 366.13 | -1.87 | 4,993 | 4,993 | 6,033 | 534 |
| Hubert H Moss |
|
96.9 | 714.30 | -0.70 | 23,405 | 23,308 | 24,058 | 1,063 |
| Joe Pool |
|
99.0 | 521.77 | -0.23 | 149,468 | 148,098 | 149,629 | 6,630 |
| Lavon |
|
98.1 | 491.63 | -0.37 | 405,000 | 402,159 | 409,757 | 20,453 |
| Lewisville |
|
98.8 | 521.74 | -0.26 | 591,901 | 556,227 | 563,228 | 26,824 |
| Lost Creek |
|
93.1 | 1,007.42 | -2.08 | 11,127 | 11,127 | 11,950 | - n.a. - |
| Mountain Creek |
|
100.0 | 457.52 | 0.52 | 24,169 | 22,850 | 22,850 | 2,828 |
| Navarro Mills |
|
94.4 | 423.90 | -0.60 | 47,040 | 47,039 | 49,827 | 4,585 |
| New Terrell City |
|
30.4 | 494.80 | -9.20 | 2,621 | 2,610 | 8,583 | 408 |
| Ray Hubbard |
|
97.4 | 434.95 | -0.55 | 428,206 | 428,206 | 439,559 | 20,407 |
| Ray Roberts |
|
99.9 | 632.48 | -0.02 | 787,923 | 787,600 | 788,167 | 28,578 |
| Richland-Chambers |
|
96.5 | 314.11 | -0.89 | 1,086,468 | 1,060,685 | 1,099,417 | 43,163 |
| Texoma 1 |
|
100.0 | 618.39 | 1.39 | 2,595,545 | 1,243,801 | 1,243,801 | 80,874 |
| Waxahachie |
|
95.6 | 530.75 | -0.75 | 11,155 | 10,573 | 11,060 | 644 |
| Weatherford |
|
63.9 | 889.47 | -6.53 | 11,384 | 11,384 | 17,812 | 899 |
| Worth |
|
78.3 | 592.41 | -1.59 | 28,196 | 19,120 | 24,419 | 3,238 |
footnotes
1
Lake Texoma straddles the border of Texas and Oklahoma, Texas has rights to 50% of Lake Texoma's total conservation capacity. Percent full, conservation storage and conservation capacity are based on the Texas share.