South-Central Climate Division Reservoirs: Monitored Water Supply Reservoirs are 90.3% full on 2026-07-23
Historical Data
| Date | Percent Full |
Reservoir Storage (acre-ft) |
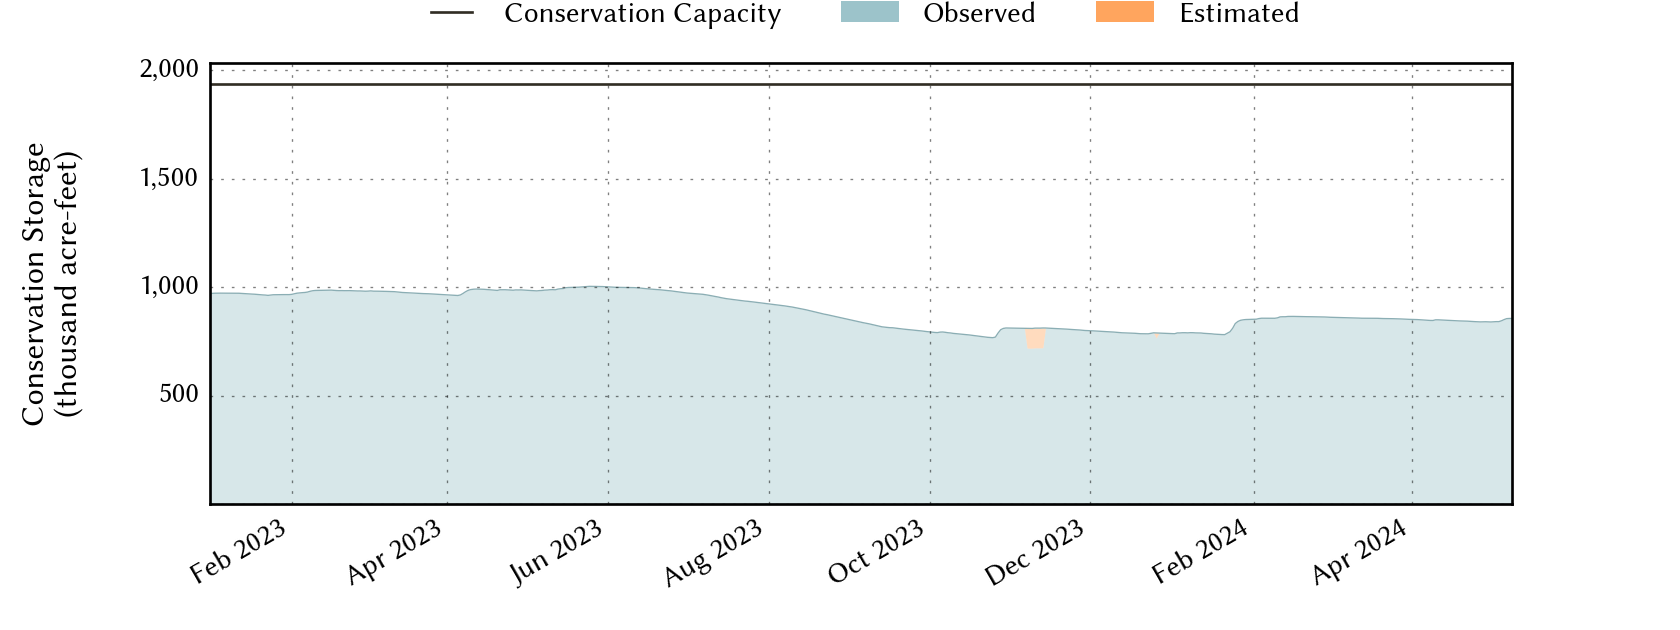
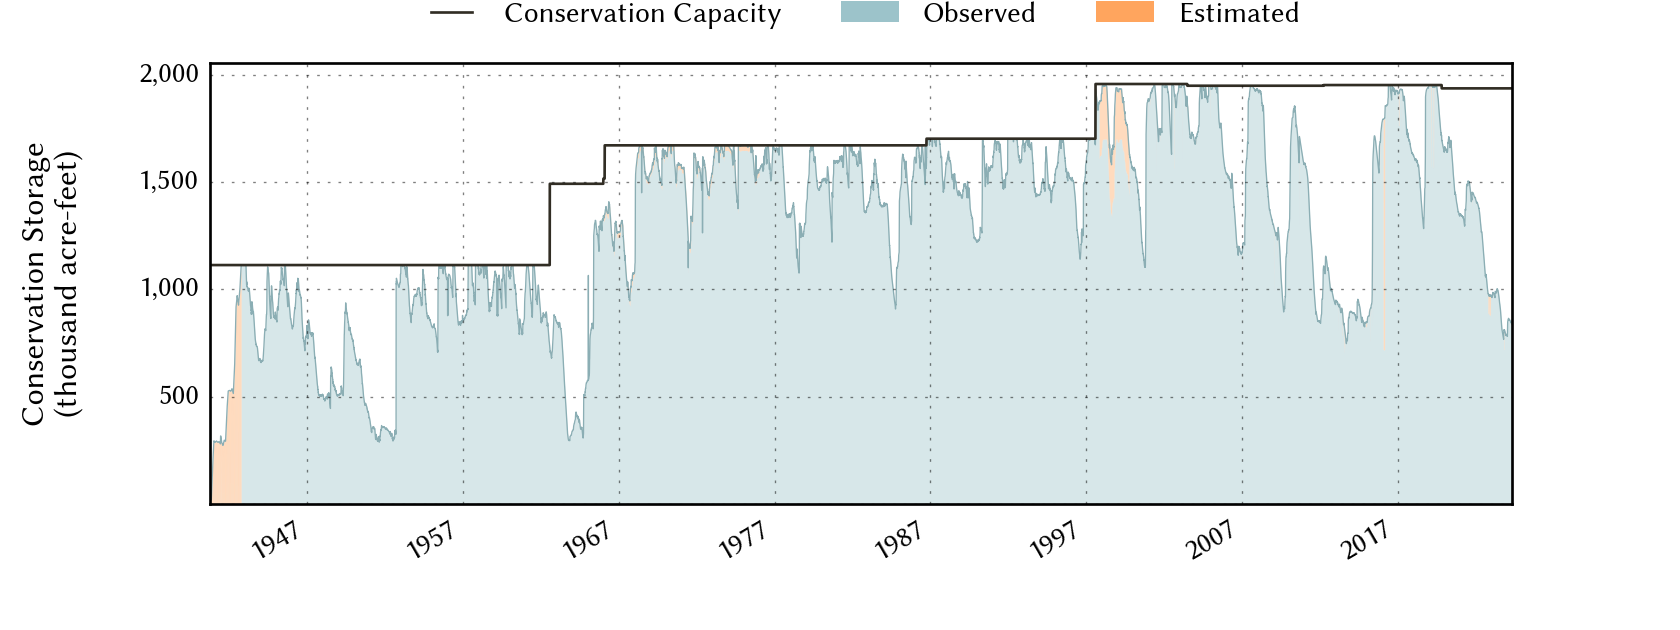
Conservation Storage (acre-ft) |
Conservation Capacity (acre-ft) |
|
|---|---|---|---|---|---|
| Today | 2026-07-23 | 90.3 | 1,825,260 | 1,748,345 | 1,936,953 |
| Yesterday | 2026-07-22 | 90.2 | 1,829,821 | 1,747,705 | 1,936,953 |
| 2 days ago | 2026-07-21 | 90.2 | 1,839,786 | 1,746,642 | 1,936,953 |
| 1 week ago | 2026-07-16 | 75.2 | 1,504,855 | 1,457,209 | 1,936,953 |
| 1 month ago | 2026-06-23 | 72.5 | 1,452,169 | 1,404,523 | 1,936,953 |
| 3 months ago | 2026-04-23 | 61.8 | 1,214,661 | 1,196,949 | 1,936,953 |
| 6 months ago | 2026-01-23 | 64.9 | 1,275,624 | 1,257,912 | 1,936,953 |
| 1 year ago | 2025-07-23 | 76.0 | 1,494,220 | 1,471,737 | 1,936,953 |
*
Percent Full is based on Conservation Storage and Conservation Capacity and doesn't account for storage in flood pool.
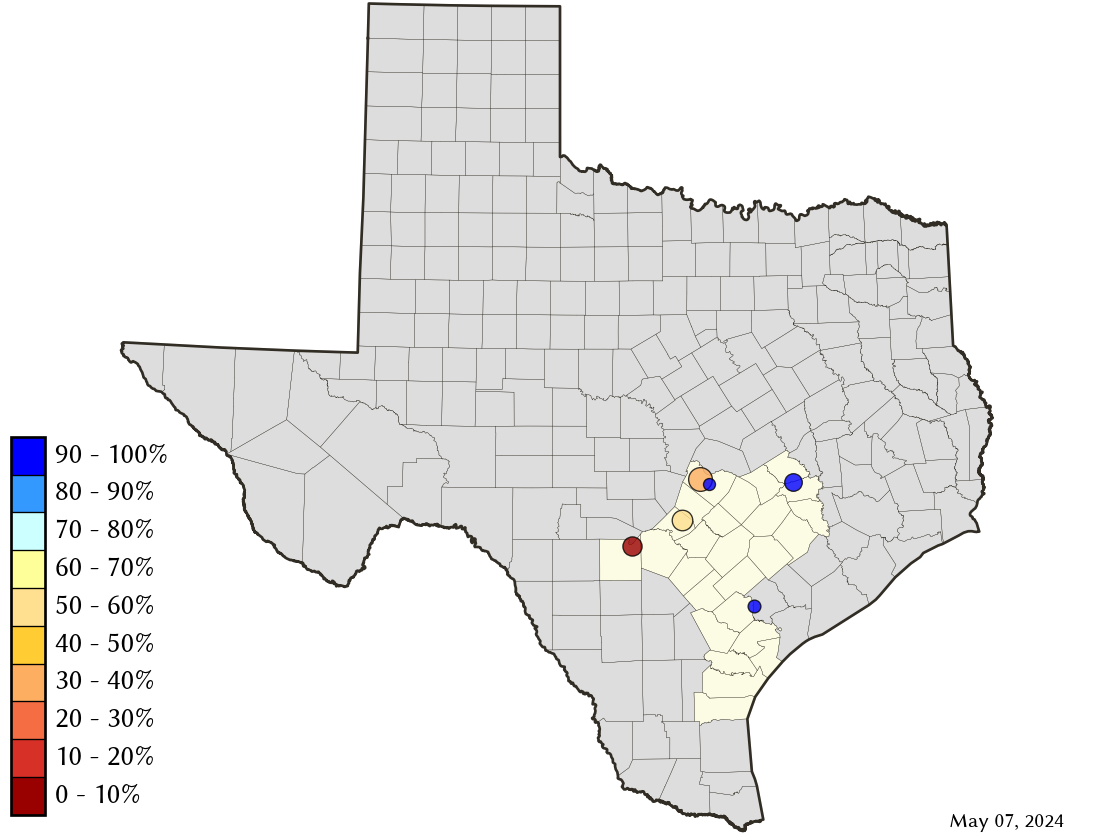
Area Map
Reservoir Storage
| Reservoir | Type | Percent Full |
Water Level (ft) |
Height Above Conservation Pool (ft) |
Reservoir Storage (acre-ft) |
Conservation Storage (acre-ft) |
Conservation Capacity (acre-ft) |
Surface Area (acres) |
|---|---|---|---|---|---|---|---|---|
| Austin |

|
97.4 | 492.40 | -0.40 | 23,953 | 23,344 | 23,972 | 1,557 |
| Canyon |

|
100.0 | 909.44 | 0.44 | 382,488 | 378,781 | 378,781 | - n.a. - |
| Coleto Creek |
|
83.5 | 95.85 | -2.15 | 25,909 | 25,909 | 31,040 | 2,348 |
| Medina |
|
28.2 | 1,020.21 | -43.99 | 71,974 | 71,974 | 254,823 | 2,420 |
| Somerville |
|
100.0 | 240.01 | 2.01 | 173,917 | 150,293 | 150,293 | - n.a. - |
| Travis |
|
100.0 | 682.66 | 1.66 | 1,147,019 | 1,098,044 | 1,098,044 | 19,443 |