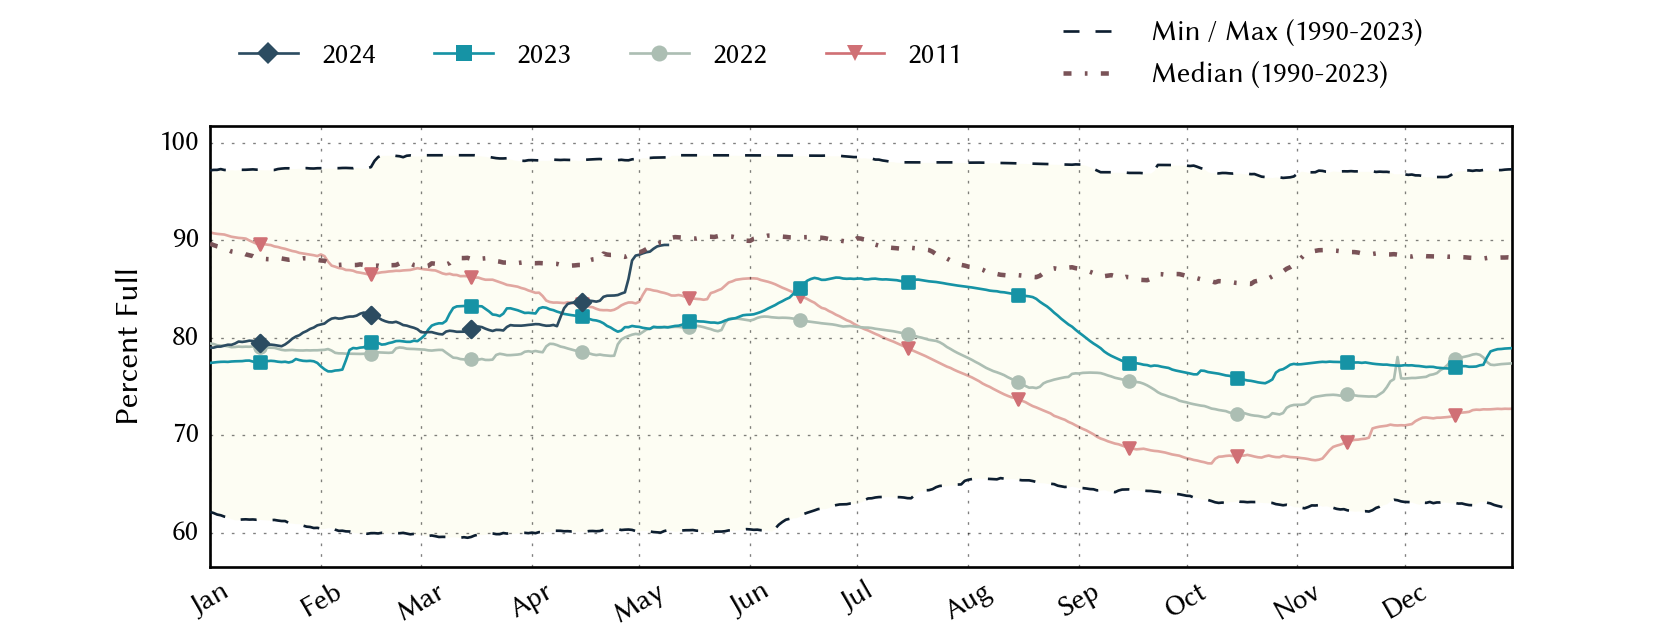
Red River Basin Reservoirs: Monitored Water Supply Reservoirs are 91.7% full on 2026-07-23
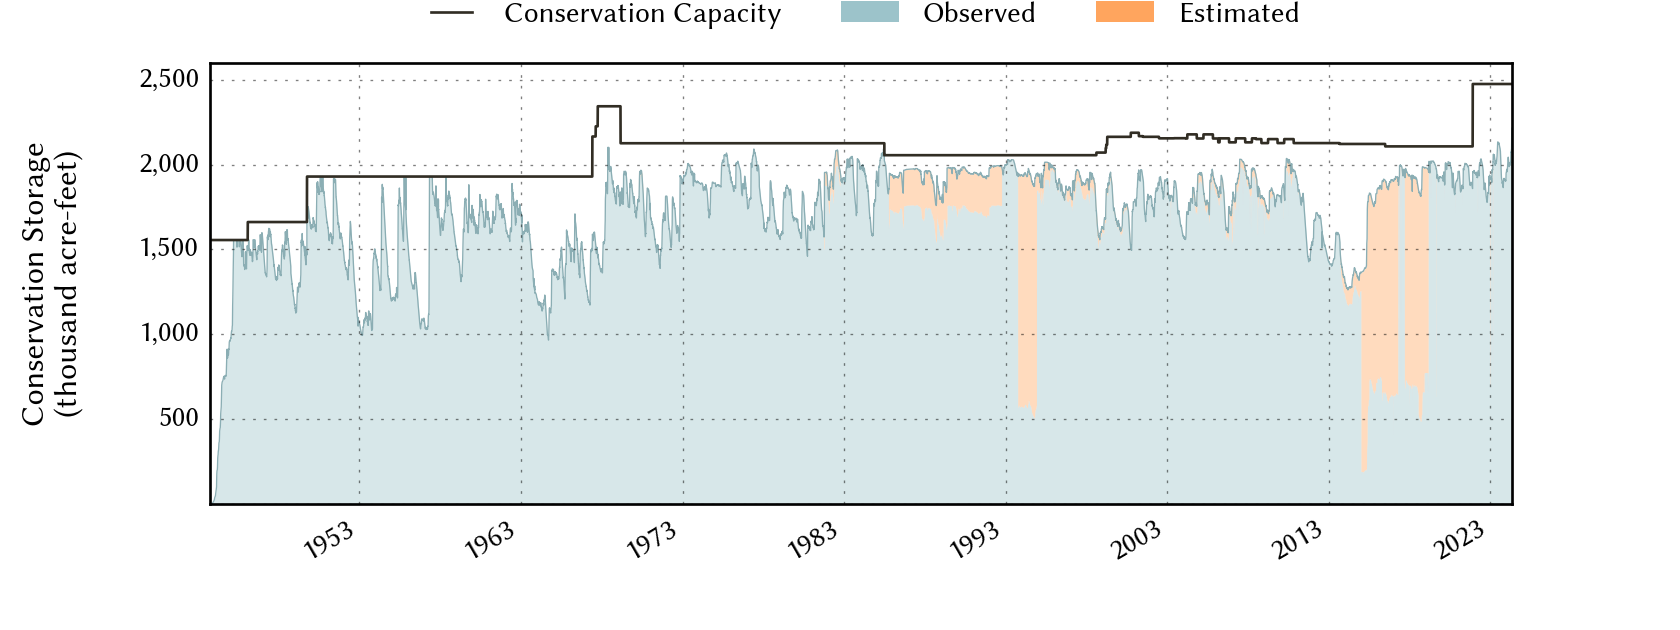
Historical Data
| Date | Percent Full |
Reservoir Storage (acre-ft) |
Conservation Storage (acre-ft) |
Conservation Capacity (acre-ft) |
|
|---|---|---|---|---|---|
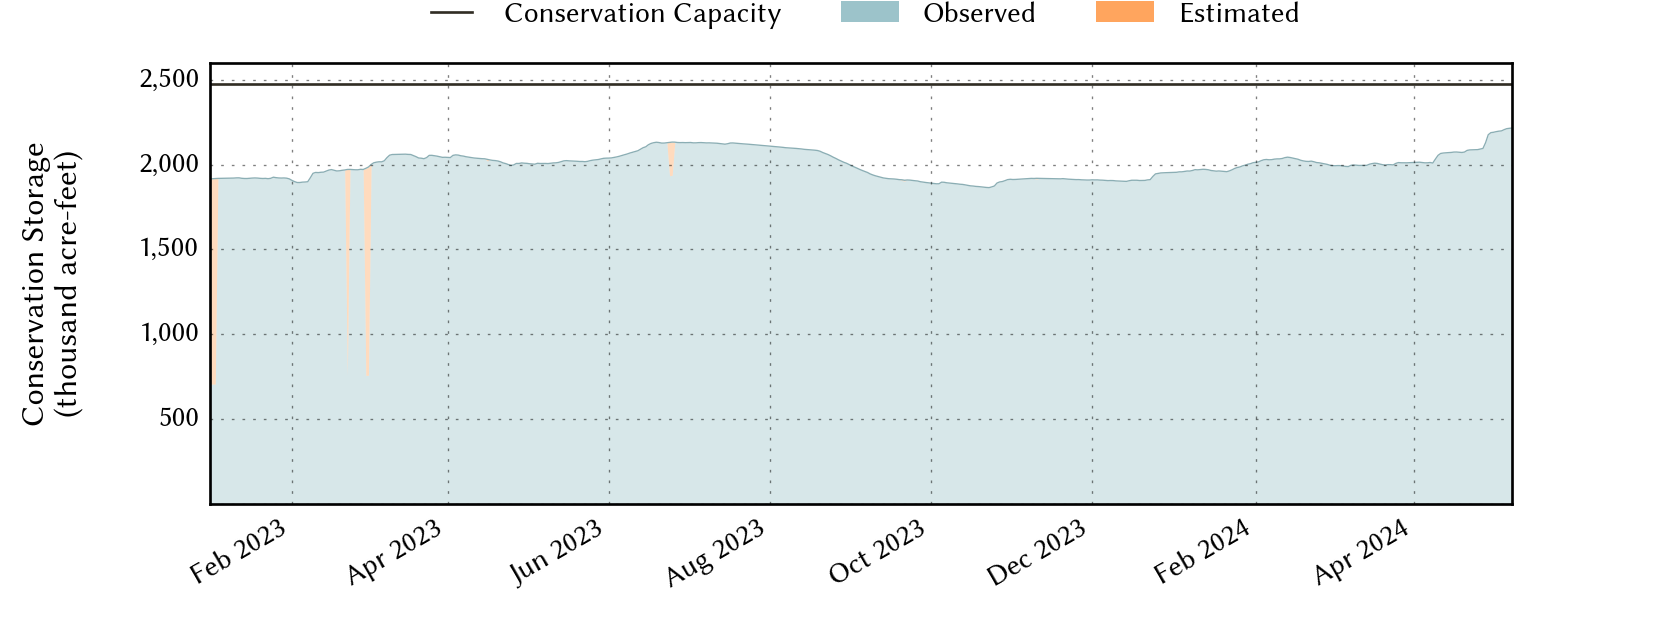
| Today | 2026-07-23 | 91.7 | 3,635,230 | 2,268,791 | 2,474,646 |
| Yesterday | 2026-07-22 | 91.8 | 3,643,012 | 2,270,597 | 2,474,646 |
| 2 days ago | 2026-07-21 | 91.8 | 3,647,255 | 2,272,050 | 2,474,646 |
| 1 week ago | 2026-07-16 | 91.9 | 3,661,533 | 2,274,984 | 2,474,646 |
| 1 month ago | 2026-06-23 | 93.8 | 3,751,073 | 2,320,783 | 2,474,646 |
| 3 months ago | 2026-04-23 | 91.4 | 3,525,547 | 2,262,762 | 2,474,646 |
| 6 months ago | 2026-01-23 | 90.6 | 3,489,405 | 2,242,319 | 2,474,646 |
| 1 year ago | 2025-07-23 | 95.6 | 3,771,128 | 2,366,249 | 2,474,646 |
*
Percent Full is based on Conservation Storage and Conservation Capacity and doesn't account for storage in flood pool.
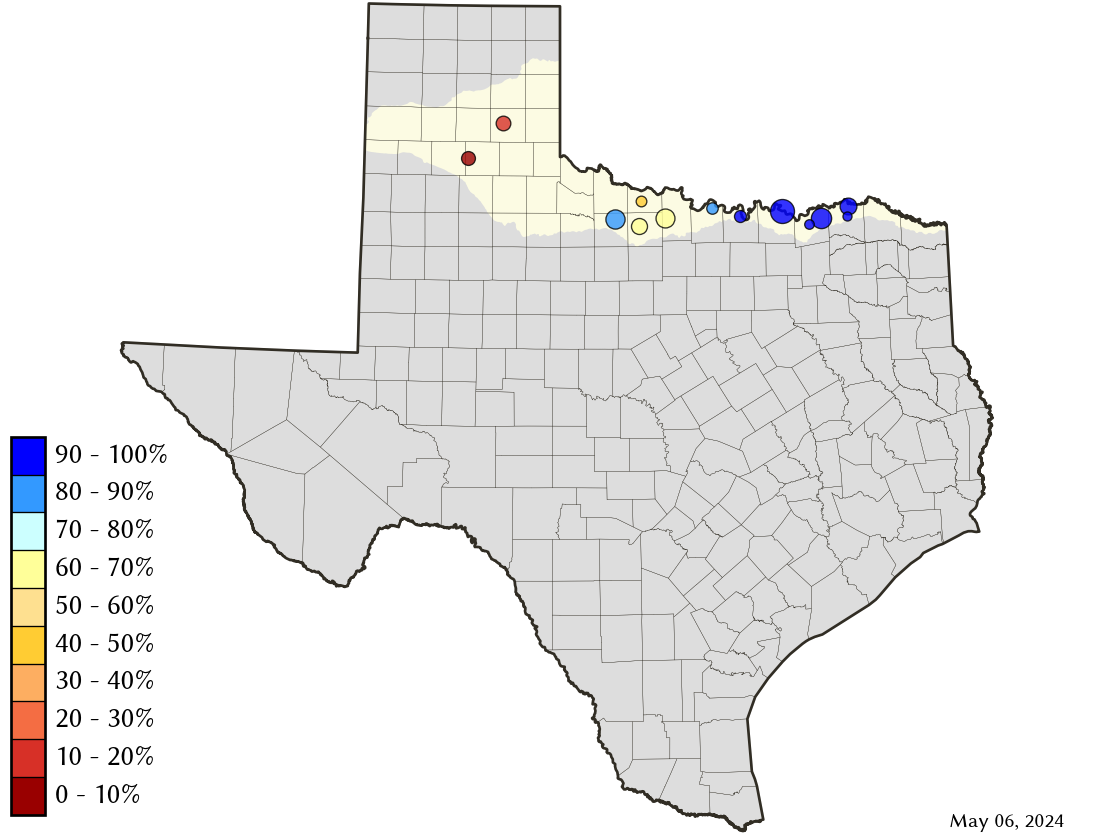
Area Map
Reservoir Storage
| Reservoir | Type | Percent Full |
Water Level (ft) |
Height Above Conservation Pool (ft) |
Reservoir Storage (acre-ft) |
Conservation Storage (acre-ft) |
Conservation Capacity (acre-ft) |
Surface Area (acres) |
|---|---|---|---|---|---|---|---|---|
| Arrowhead |

|
79.7 | 922.56 | -3.44 | 183,511 | 183,511 | 230,359 | 12,732 |
| Bois d'Arc |
|
99.1 | 533.80 | -0.20 | 364,395 | 364,395 | 367,609 | 16,440 |
| Bonham |
|
95.3 | 564.50 | -0.50 | 10,518 | 10,506 | 11,027 | 1,029 |
| Crook |
|
98.7 | 475.89 | -0.11 | 9,095 | 9,080 | 9,195 | 1,045 |
| Greenbelt |
|
5.8 | 2,609.36 | -54.64 | 3,896 | 3,464 | 59,968 | 312 |
| Hubert H Moss |
|
97.1 | 714.35 | -0.65 | 23,458 | 23,361 | 24,058 | 1,064 |
| Kemp |

|
83.7 | 1,141.87 | -2.13 | 205,465 | 205,339 | 245,307 | 11,590 |
| Kickapoo |
|
87.3 | 1,043.06 | -1.94 | 75,397 | 75,397 | 86,345 | 5,423 |
| Mackenzie |
|
11.7 | 3,020.11 | -79.89 | 5,415 | 5,415 | 46,450 | 246 |
| Nocona |
|
81.0 | 824.33 | -3.17 | 17,680 | 17,376 | 21,444 | 1,224 |
| North Fork Buffalo Creek |
|
87.4 | 1,046.78 | -1.22 | 13,463 | 13,463 | 15,400 | 1,382 |
| Pat Mayse |
|
100.0 | 451.56 | 0.56 | 121,018 | 113,683 | 113,683 | - n.a. - |
| Texoma 1 |
|
100.0 | 618.47 | 1.47 | 2,601,919 | 1,243,801 | 1,243,801 | 81,493 |
footnotes
1
Lake Texoma straddles the border of Texas and Oklahoma, Texas has rights to 50% of Lake Texoma's total conservation capacity. Percent full, conservation storage and conservation capacity are based on the Texas share.