San-Antonio River Basin Reservoirs: Monitored Water Supply Reservoirs are 23.6% full on 2026-07-17
Historical Data
| Date | Percent Full |
Reservoir Storage (acre-ft) |
Conservation Storage (acre-ft) |
Conservation Capacity (acre-ft) |
|
|---|---|---|---|---|---|
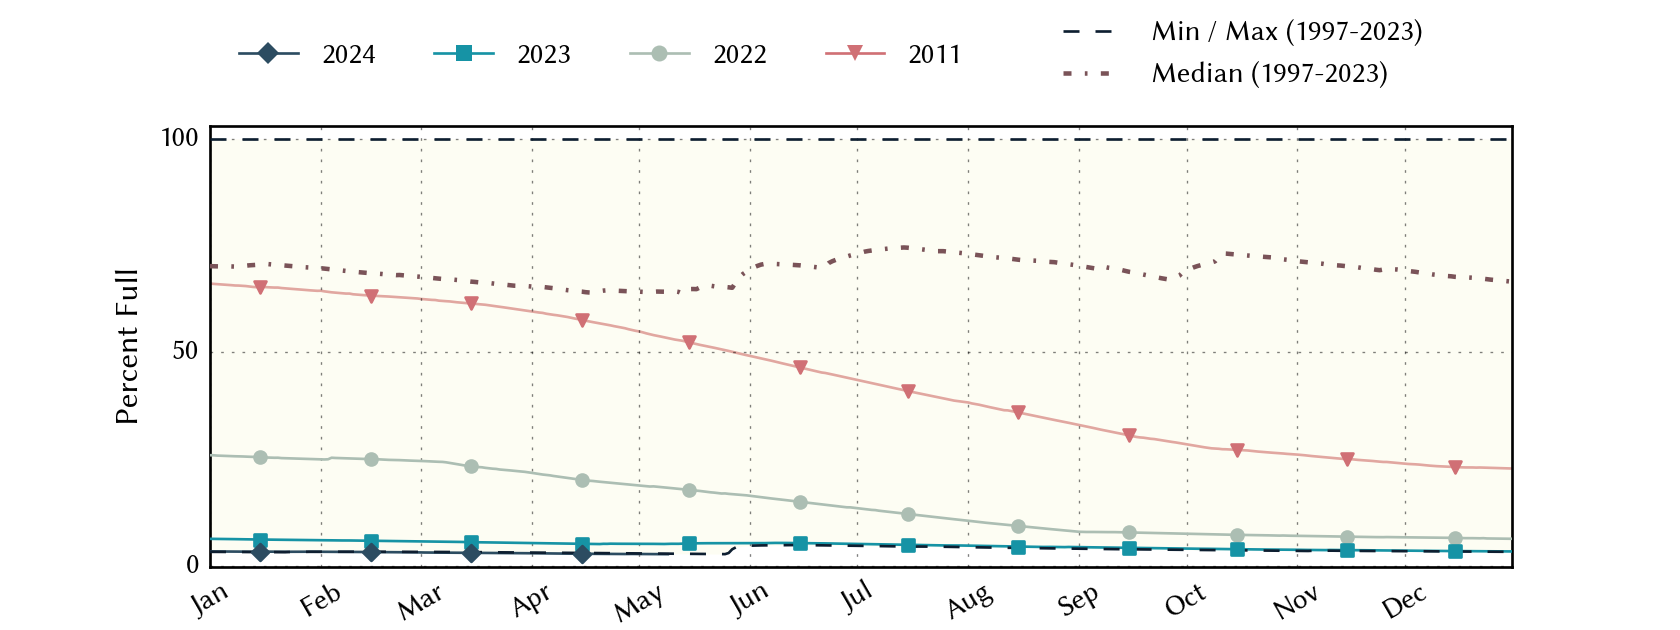
| Today | 2026-07-17 | 23.6 | 60,153 | 60,153 | 254,823 |
| Yesterday | 2026-07-16 | 20.9 | 53,170 | 53,170 | 254,823 |
| 2 days ago | 2026-07-15 | 12.9 | 32,759 | 32,759 | 254,823 |
| 1 week ago | 2026-07-10 | 9.0 | 22,914 | 22,914 | 254,823 |
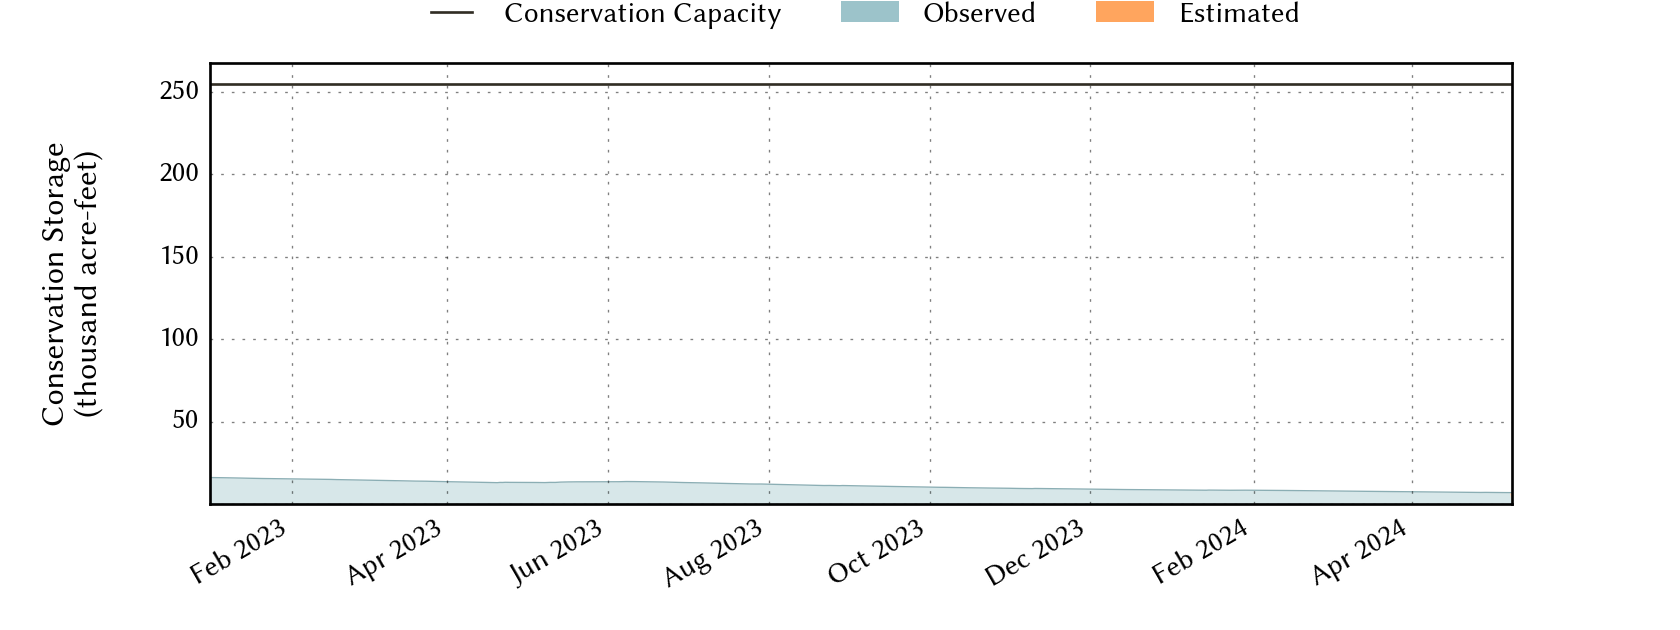
| 1 month ago | 2026-06-17 | 5.6 | 14,256 | 14,256 | 254,823 |
| 3 months ago | 2026-04-17 | 3.8 | 9,755 | 9,755 | 254,823 |
| 6 months ago | 2026-01-17 | 4.5 | 11,579 | 11,579 | 254,823 |
| 1 year ago | 2025-07-17 | 5.9 | 14,960 | 14,960 | 254,823 |
*
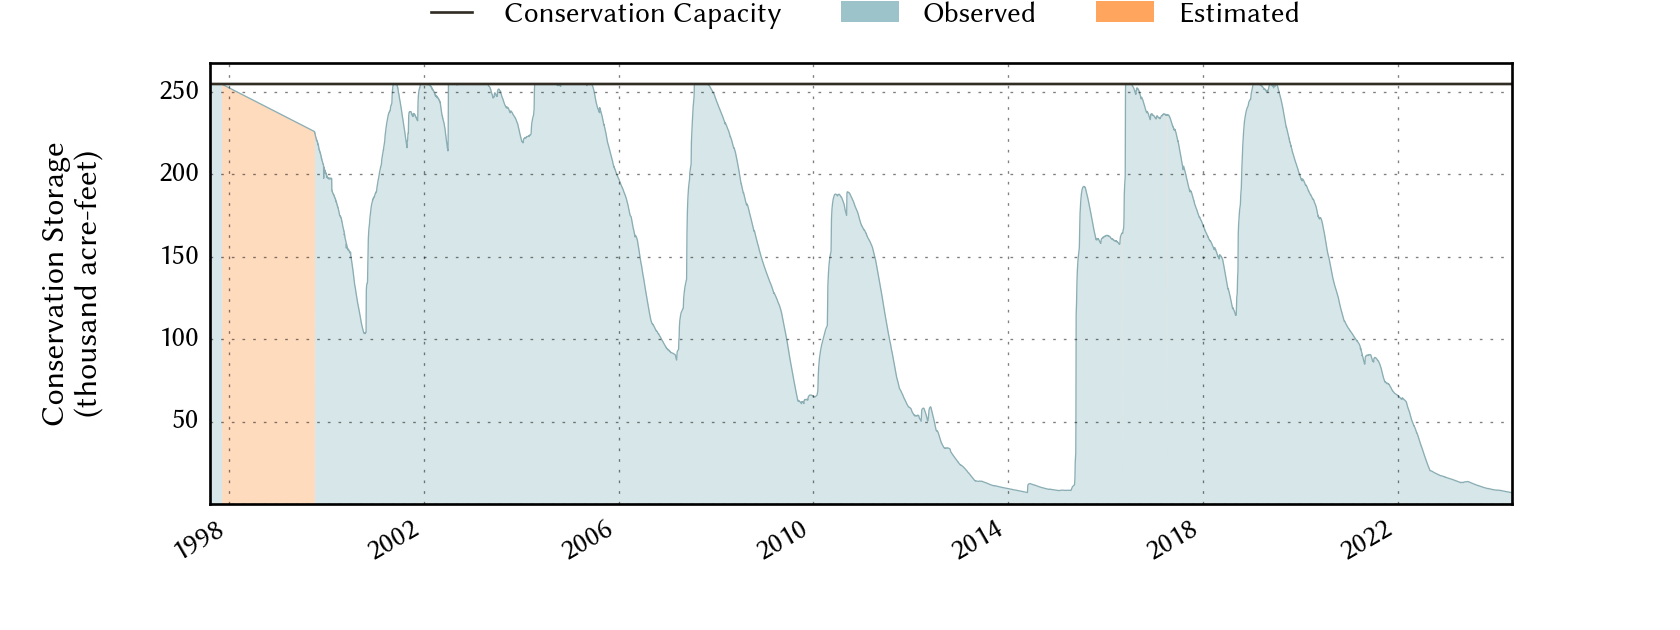
Percent Full is based on Conservation Storage and Conservation Capacity and doesn't account for storage in flood pool.
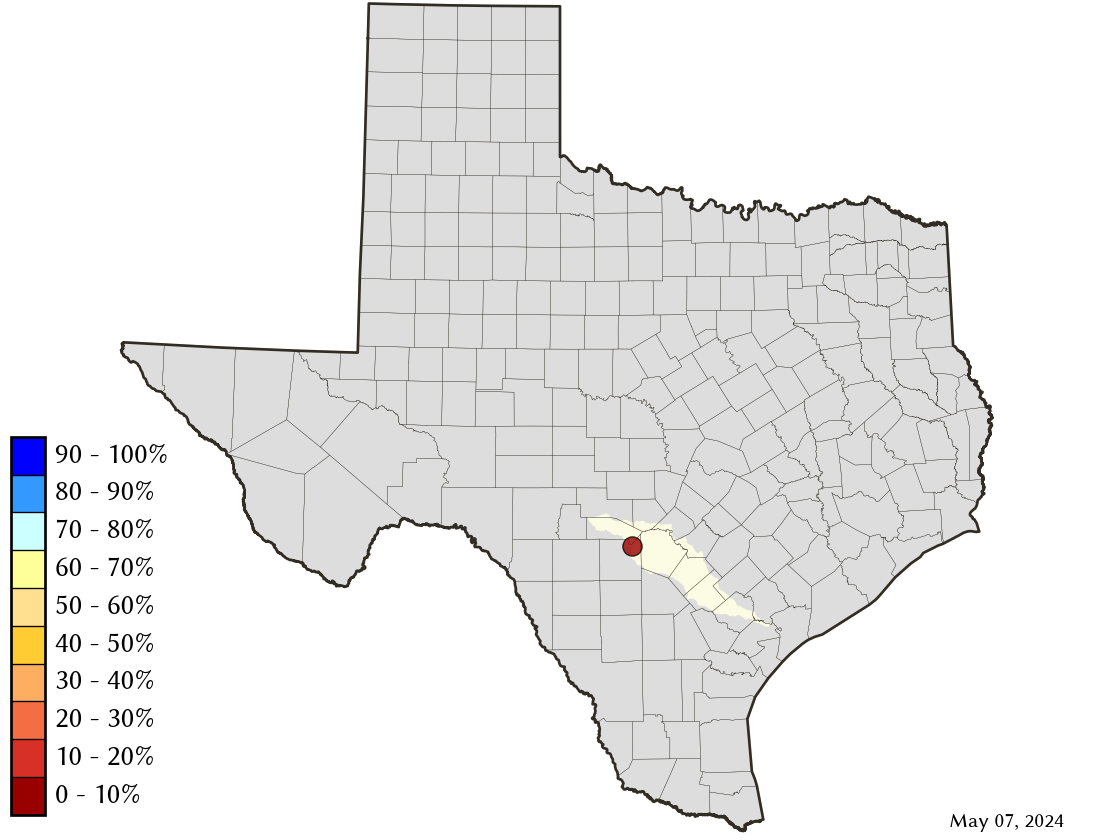
Area Map
Reservoir Storage
| Reservoir | Type | Percent Full |
Water Level (ft) |
Height Above Conservation Pool (ft) |
Reservoir Storage (acre-ft) |
Conservation Storage (acre-ft) |
Conservation Capacity (acre-ft) |
Surface Area (acres) |
|---|---|---|---|---|---|---|---|---|
| Medina |

|
23.6 | 1,014.98 | -49.22 | 60,153 | 60,153 | 254,823 | 2,121 |