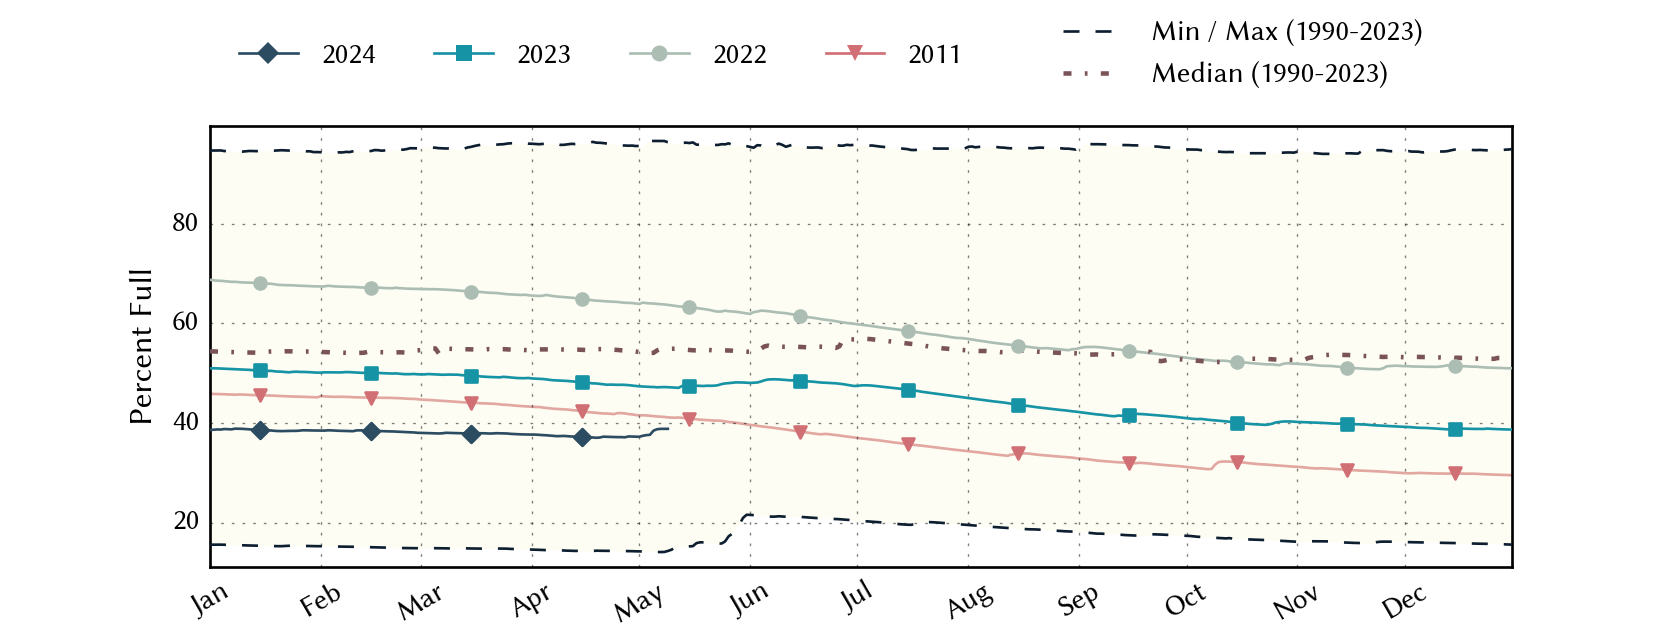
Abilene Area Reservoirs: Monitored Water Supply Reservoirs are 46.9% full on 2026-07-23
Historical Data
| Date | Percent Full |
Reservoir Storage (acre-ft) |
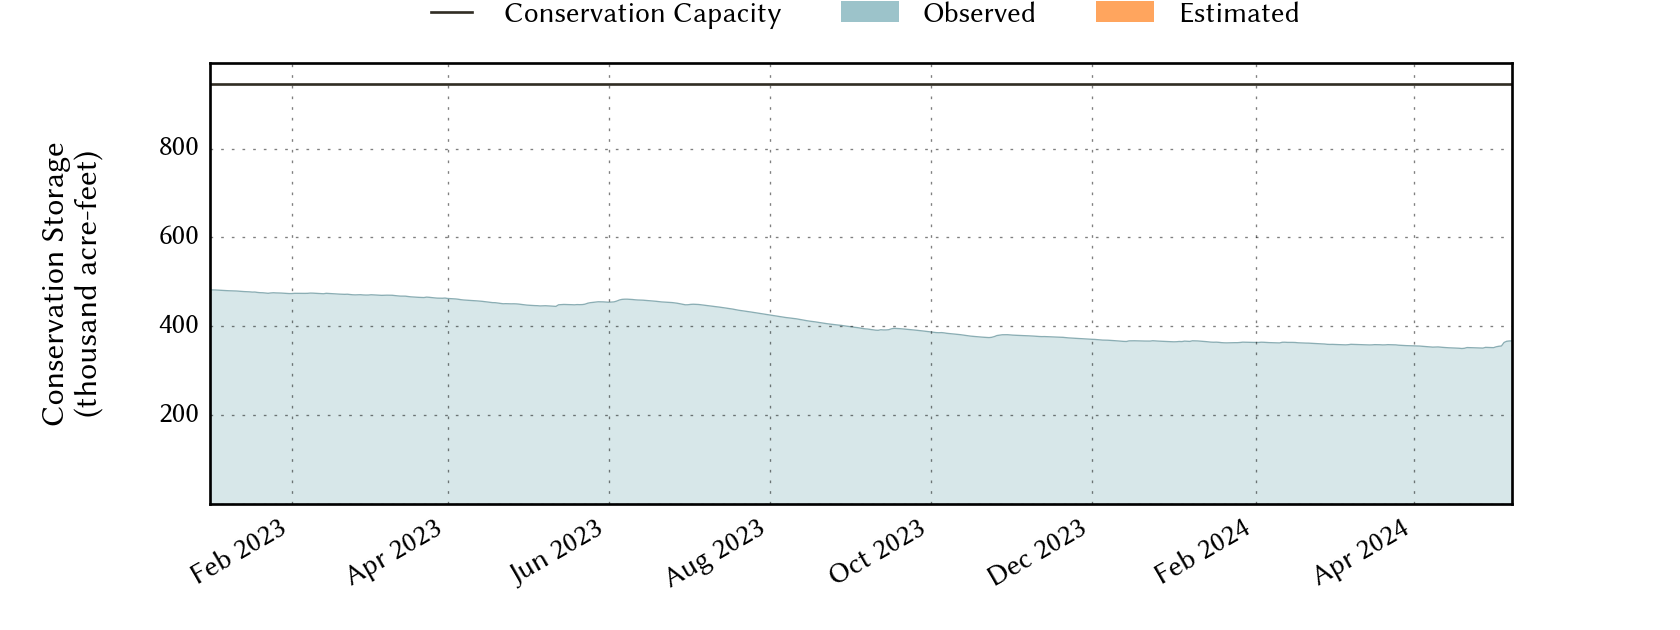
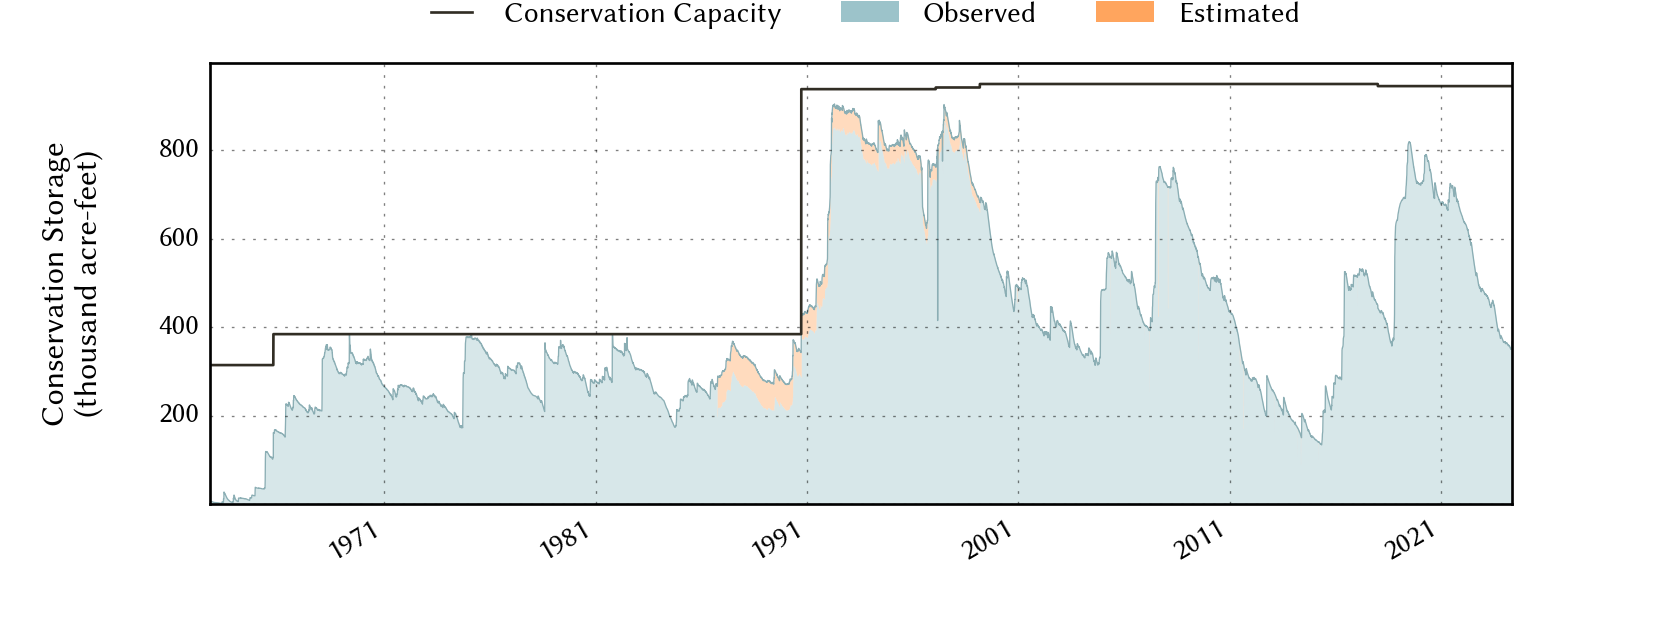
Conservation Storage (acre-ft) |
Conservation Capacity (acre-ft) |
|
|---|---|---|---|---|---|
| Today | 2026-07-23 | 46.9 | 448,295 | 443,413 | 945,568 |
| Yesterday | 2026-07-22 | 46.9 | 448,685 | 443,803 | 945,568 |
| 2 days ago | 2026-07-21 | 47.0 | 449,312 | 444,430 | 945,568 |
| 1 week ago | 2026-07-16 | 46.8 | 447,044 | 442,162 | 945,568 |
| 1 month ago | 2026-06-23 | 48.5 | 463,476 | 458,594 | 945,568 |
| 3 months ago | 2026-04-23 | 48.3 | 462,020 | 457,138 | 945,568 |
| 6 months ago | 2026-01-23 | 46.9 | 448,410 | 443,528 | 945,568 |
| 1 year ago | 2025-07-23 | 55.8 | 532,670 | 527,788 | 945,568 |
*
Percent Full is based on Conservation Storage and Conservation Capacity and doesn't account for storage in flood pool.
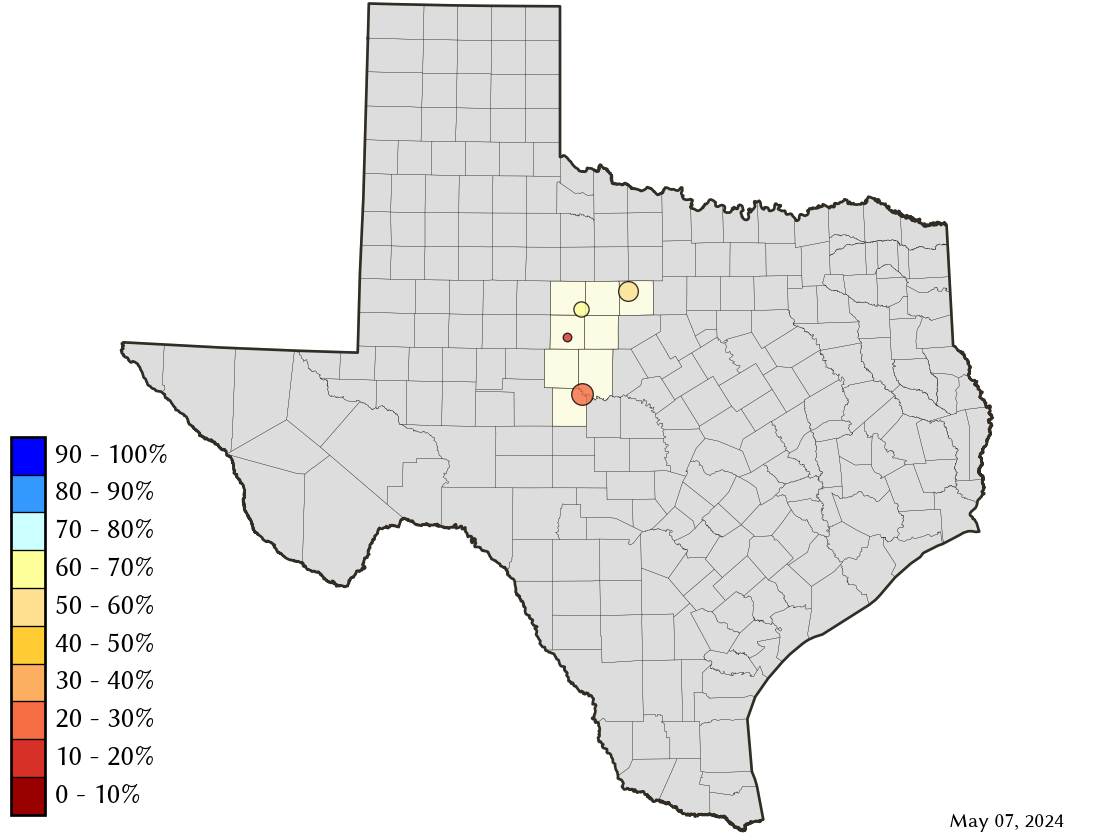
Area Map
Reservoir Storage
| Reservoir | Type | Percent Full |
Water Level (ft) |
Height Above Conservation Pool (ft) |
Reservoir Storage (acre-ft) |
Conservation Storage (acre-ft) |
Conservation Capacity (acre-ft) |
Surface Area (acres) |
|---|---|---|---|---|---|---|---|---|
| Abilene |

|
13.7 | 1,994.60 | -17.70 | 1,084 | 1,084 | 7,900 | 181 |
| Fort Phantom Hill |
|
76.2 | 1,631.22 | -4.68 | 53,389 | 53,383 | 70,030 | 3,206 |
| Hubbard Creek |
|
41.4 | 1,168.10 | -15.21 | 134,457 | 129,581 | 313,298 | 8,733 |
| O H Ivie |
|
46.8 | 1,532.05 | -19.45 | 259,365 | 259,365 | 554,340 | - n.a. - |