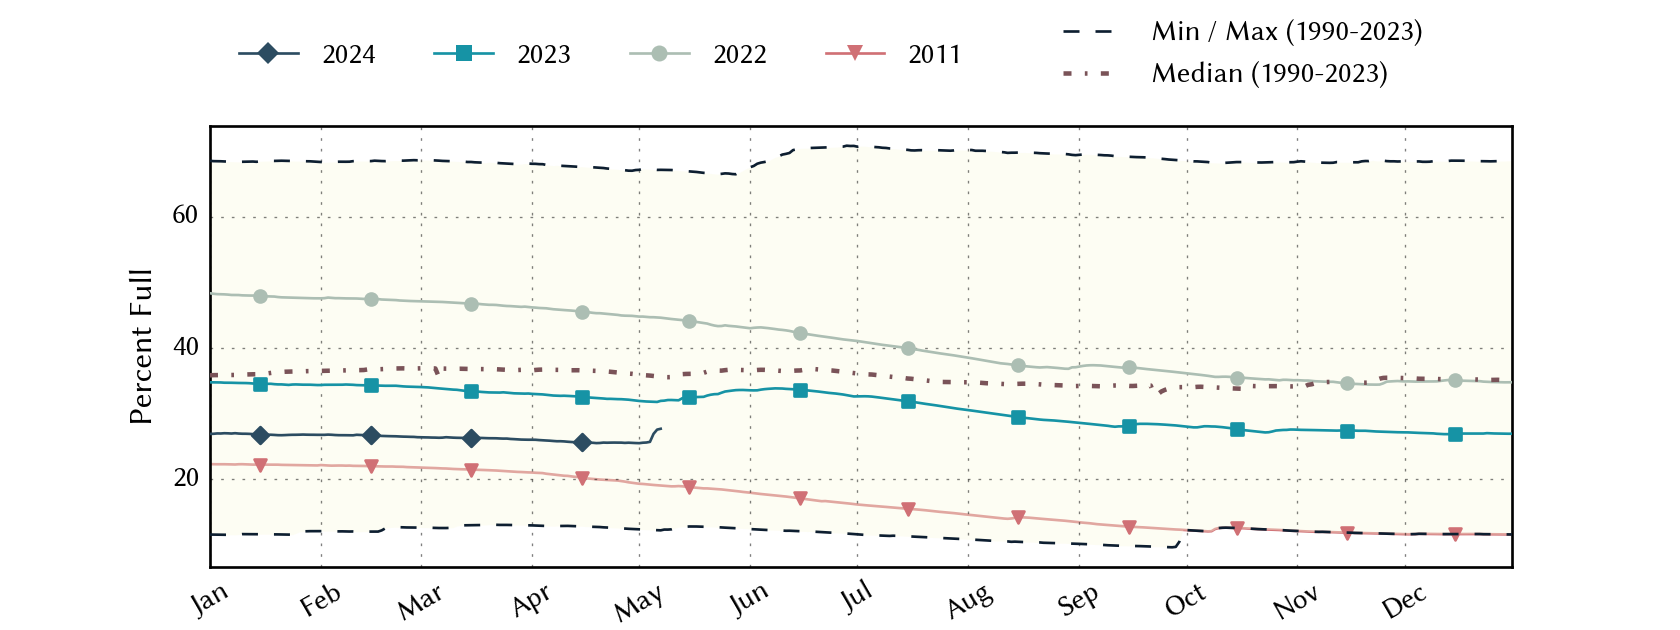
Region-F Planning Region Reservoirs: Monitored Water Supply Reservoirs are 33.8% full on 2026-07-31
Historical Data
| Date | Percent Full |
Reservoir Storage (acre-ft) |
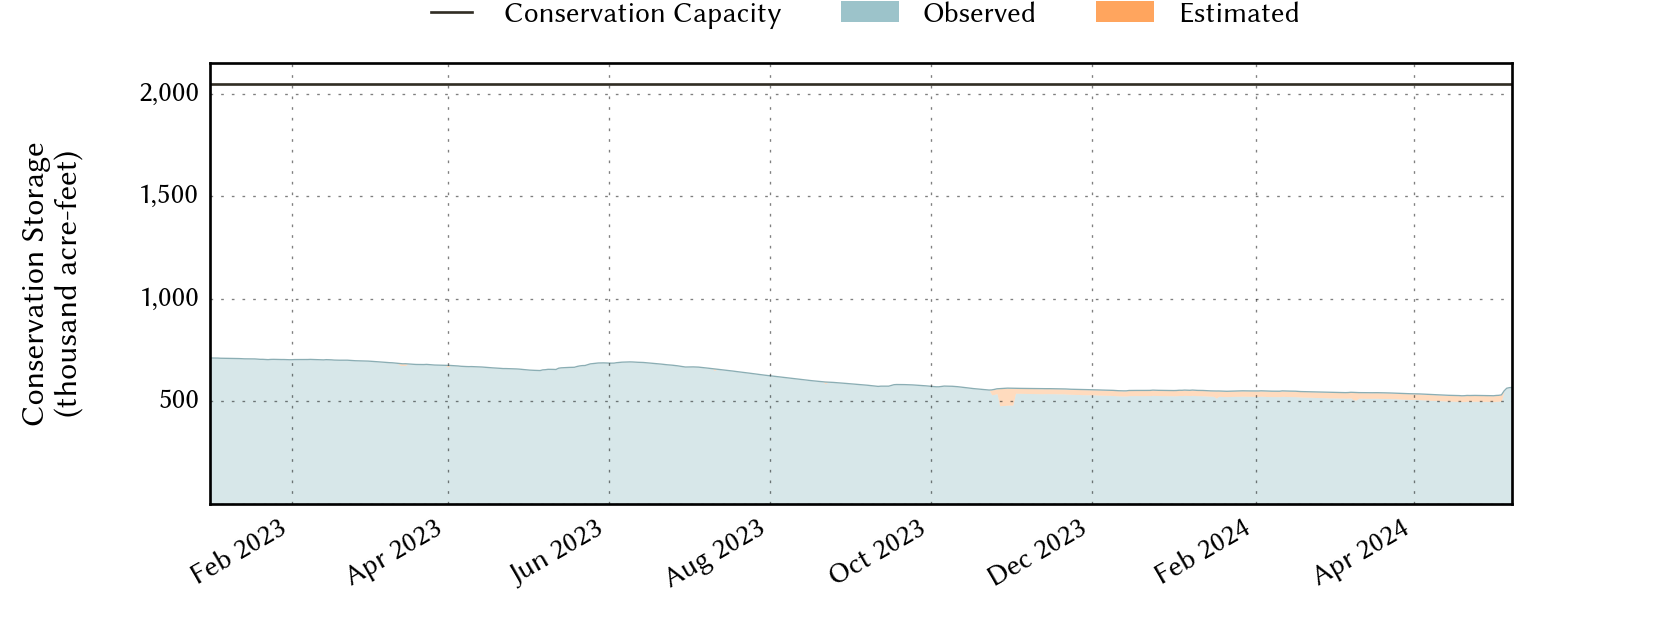
Conservation Storage (acre-ft) |
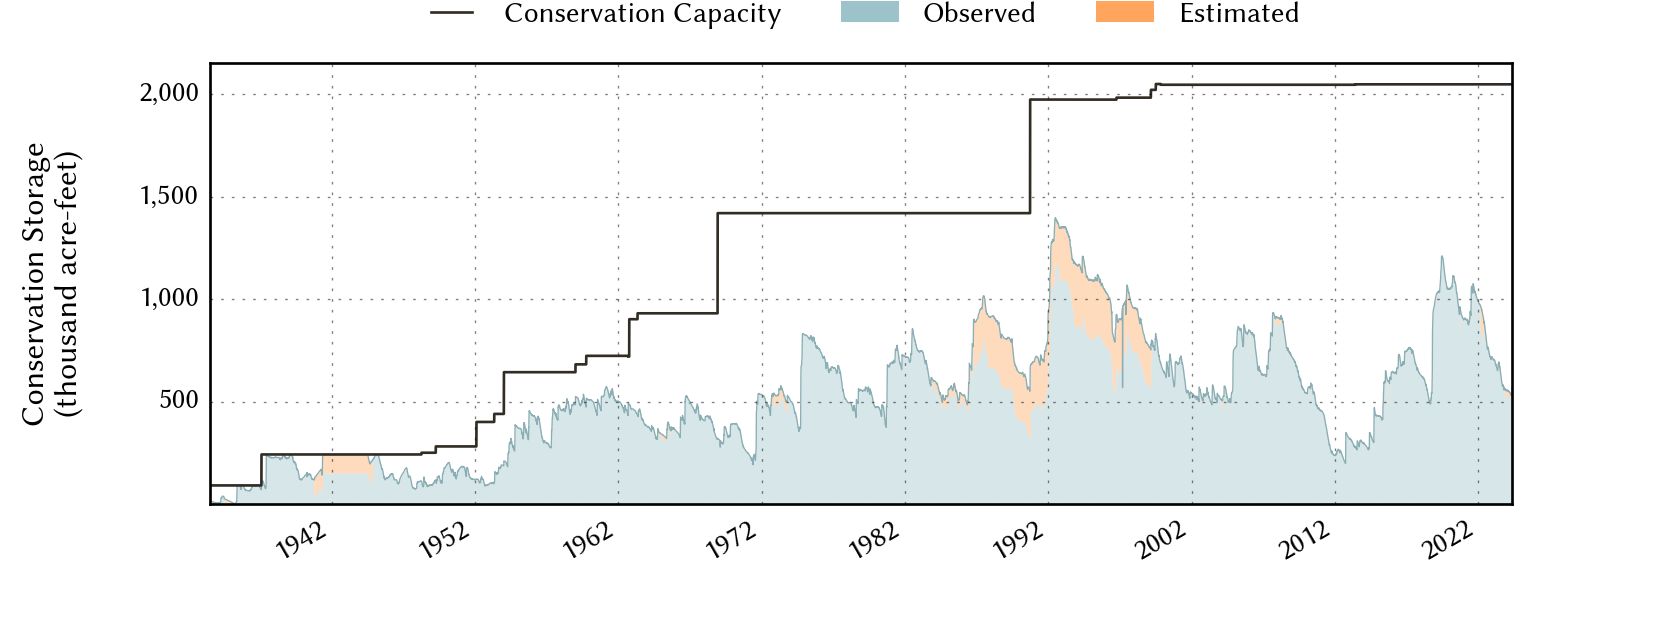
Conservation Capacity (acre-ft) |
|
|---|---|---|---|---|---|
| Today | 2026-07-31 | 33.8 | 697,846 | 691,137 | 2,041,927 |
| Yesterday | 2026-07-30 | 33.9 | 698,960 | 692,251 | 2,041,927 |
| 2 days ago | 2026-07-29 | 34.0 | 700,157 | 693,448 | 2,041,927 |
| 1 week ago | 2026-07-24 | 34.3 | 706,607 | 699,898 | 2,041,927 |
| 1 month ago | 2026-06-30 | 33.9 | 699,650 | 692,941 | 2,041,927 |
| 3 months ago | 2026-04-30 | 34.5 | 711,810 | 705,101 | 2,041,927 |
| 6 months ago | 2026-01-31 | 35.3 | 727,421 | 720,712 | 2,041,927 |
| 1 year ago | 2025-07-31 | 40.7 | 836,782 | 830,073 | 2,041,927 |
*
Percent Full is based on Conservation Storage and Conservation Capacity and doesn't account for storage in flood pool.
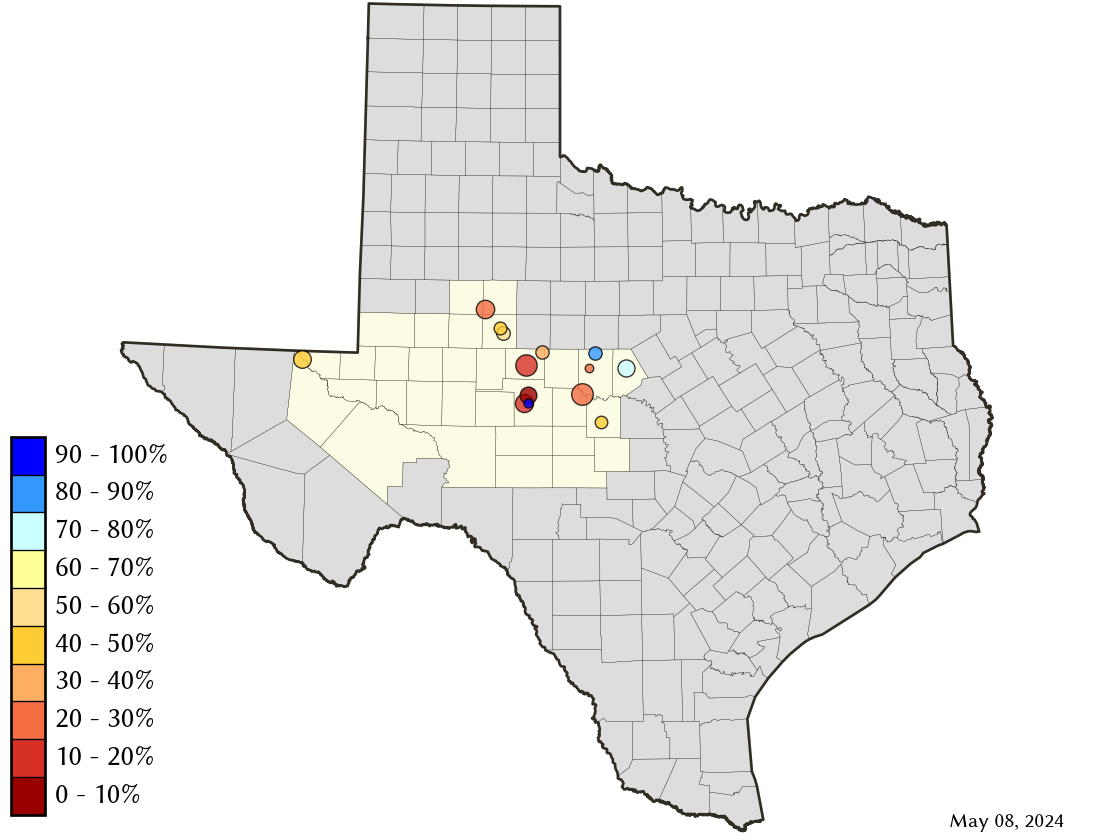
Area Map
Reservoir Storage
| Reservoir | Type | Percent Full |
Water Level (ft) |
Height Above Conservation Pool (ft) |
Reservoir Storage (acre-ft) |
Conservation Storage (acre-ft) |
Conservation Capacity (acre-ft) |
Surface Area (acres) |
|---|---|---|---|---|---|---|---|---|
| Brady Creek |

|
92.2 | 1,741.81 | -1.19 | 28,169 | 26,547 | 28,808 | 1,923 |
| Brownwood |
|
91.6 | 1,423.24 | -1.36 | 119,856 | 119,856 | 130,868 | 6,452 |
| Champion Creek |
|
45.0 | 2,063.72 | -19.28 | 18,710 | 18,710 | 41,580 | 889 |
| Coleman |
|
84.4 | 1,714.12 | -3.38 | 32,156 | 32,138 | 38,075 | 1,695 |
| Colorado City |
|
57.7 | 2,060.09 | -10.11 | 17,756 | 17,756 | 30,758 | - n.a. - |
| E V Spence |
|
10.7 | 1,844.26 | -53.74 | 55,502 | 55,502 | 517,272 | 3,542 |
| Hords Creek |

|
50.9 | 1,889.90 | -10.10 | 4,127 | 4,124 | 8,109 | 295 |
| J B Thomas |
|
23.8 | 2,228.41 | -29.59 | 48,172 | 47,499 | 199,931 | 3,315 |
| Nasworthy |
|
85.8 | 1,871.74 | -0.97 | 8,738 | 8,245 | 9,615 | 1,235 |
| O C Fisher |
|
12.5 | 1,873.97 | -34.03 | 14,521 | 14,520 | 115,742 | 1,226 |
| O H Ivie |
|
46.2 | 1,531.74 | -19.76 | 255,881 | 255,881 | 554,340 | - n.a. - |
| Oak Creek |
|
16.3 | 1,975.21 | -24.79 | 6,525 | 6,375 | 39,210 | 586 |
| Red Bluff |
|
48.2 | 2,815.54 | -12.56 | 70,007 | 70,007 | 145,165 | 4,688 |
| Twin Buttes |
|
7.7 | 1,899.54 | -40.66 | 17,726 | 13,977 | 182,454 | 1,327 |