Dallas Area Reservoirs: Monitored Water Supply Reservoirs are 96.3% full on 2026-07-31
Historical Data
| Date | Percent Full |
Reservoir Storage (acre-ft) |
Conservation Storage (acre-ft) |
Conservation Capacity (acre-ft) |
|
|---|---|---|---|---|---|
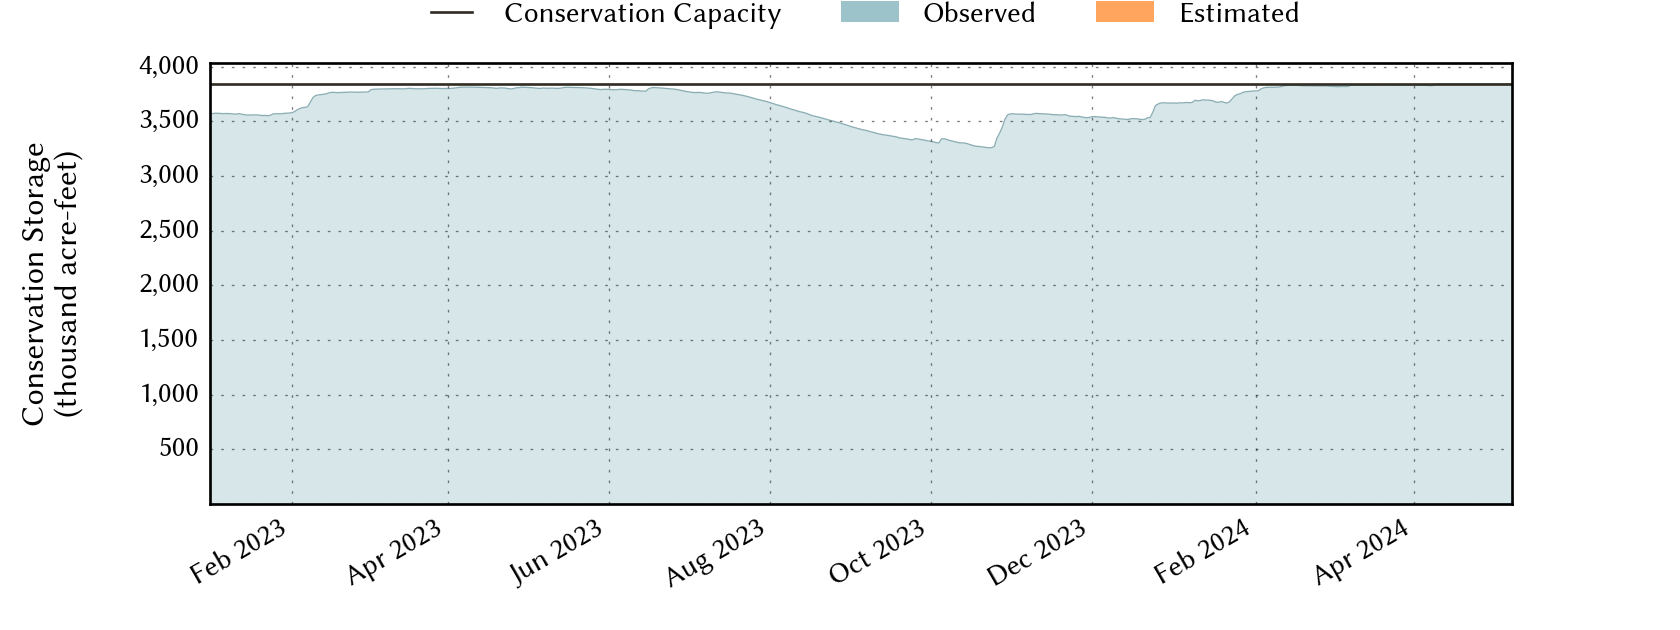
| Today | 2026-07-31 | 96.3 | 3,769,943 | 3,699,654 | 3,841,548 |
| Yesterday | 2026-07-30 | 96.5 | 3,775,657 | 3,705,368 | 3,841,548 |
| 2 days ago | 2026-07-29 | 96.6 | 3,782,178 | 3,711,889 | 3,841,548 |
| 1 week ago | 2026-07-24 | 97.4 | 3,813,830 | 3,742,615 | 3,841,548 |
| 1 month ago | 2026-06-30 | 98.6 | 3,940,124 | 3,788,459 | 3,841,548 |
| 3 months ago | 2026-04-30 | 98.1 | 3,865,574 | 3,768,801 | 3,841,548 |
| 6 months ago | 2026-01-31 | 93.0 | 3,641,513 | 3,571,224 | 3,841,548 |
| 1 year ago | 2025-07-31 | 98.6 | 3,857,892 | 3,787,324 | 3,841,548 |
*
Percent Full is based on Conservation Storage and Conservation Capacity and doesn't account for storage in flood pool.
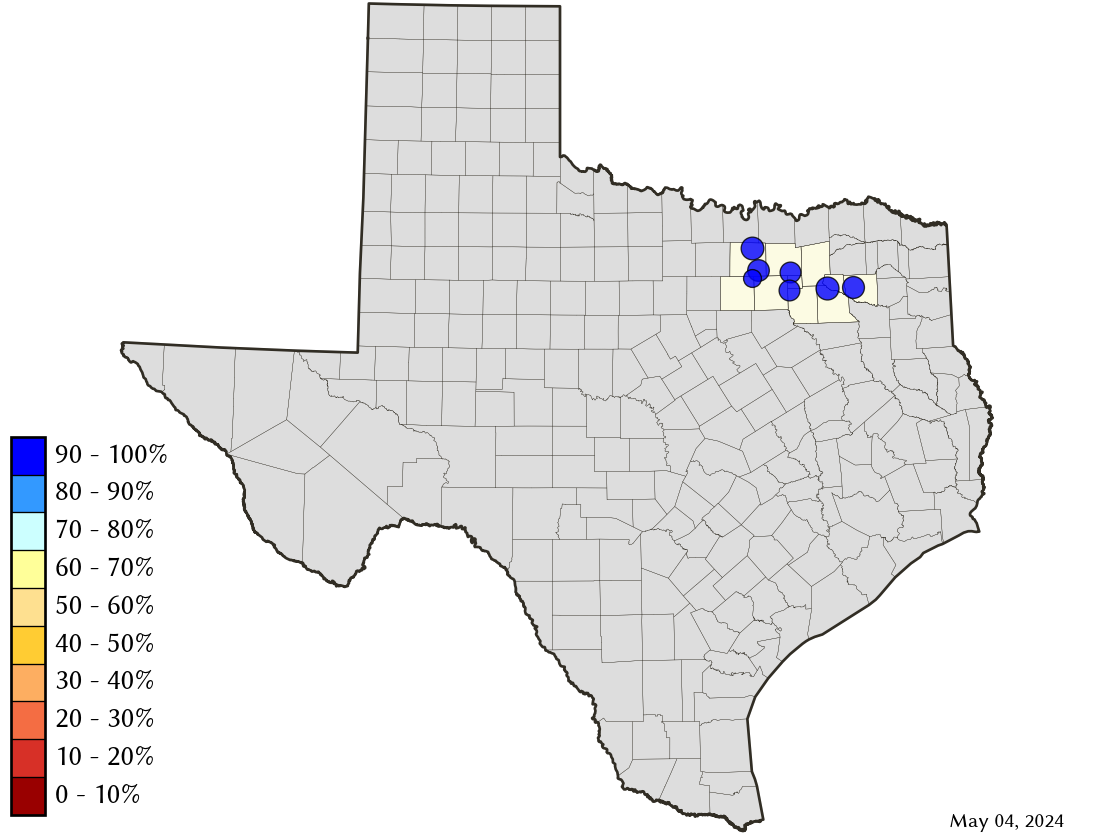
Area Map
Reservoir Storage
| Reservoir | Type | Percent Full |
Water Level (ft) |
Height Above Conservation Pool (ft) |
Reservoir Storage (acre-ft) |
Conservation Storage (acre-ft) |
Conservation Capacity (acre-ft) |
Surface Area (acres) |
|---|---|---|---|---|---|---|---|---|
| Fork |

|
87.9 | 400.14 | -2.86 | 564,344 | 532,901 | 606,088 | 24,291 |
| Grapevine |

|
99.5 | 534.87 | -0.13 | 162,208 | 162,208 | 163,064 | 6,567 |
| Lavon |
|
96.1 | 491.21 | -0.79 | 396,446 | 393,605 | 409,757 | 20,284 |
| Lewisville |
|
97.3 | 521.44 | -0.56 | 583,886 | 548,212 | 563,228 | 26,615 |
| Ray Hubbard |
|
96.1 | 434.67 | -0.83 | 422,514 | 422,514 | 439,559 | 20,264 |
| Ray Roberts |
|
99.3 | 632.30 | -0.20 | 782,828 | 782,505 | 788,167 | 28,232 |
| Tawakoni |
|
98.4 | 437.12 | -0.38 | 857,717 | 857,709 | 871,685 | 36,554 |