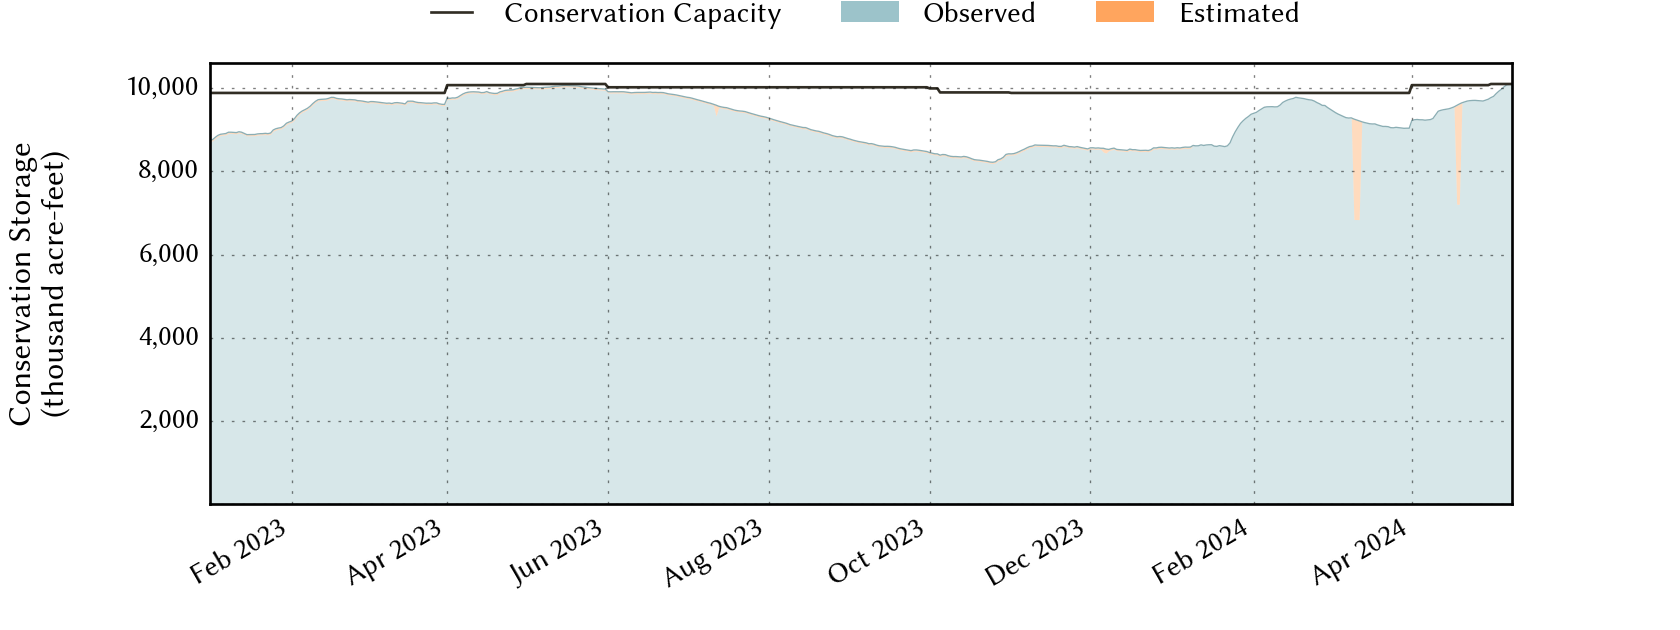
East-Texas Climate Division Reservoirs: Monitored Water Supply Reservoirs are 88.4% full on 2026-07-23
Historical Data
| Date | Percent Full |
Reservoir Storage (acre-ft) |
Conservation Storage (acre-ft) |
Conservation Capacity (acre-ft) |
|
|---|---|---|---|---|---|
| Today | 2026-07-23 | 88.4 | 11,236,831 | 8,768,607 | 9,915,173 |
| Yesterday | 2026-07-22 | 88.5 | 11,246,022 | 8,773,831 | 9,915,173 |
| 2 days ago | 2026-07-21 | 88.5 | 11,259,296 | 8,779,594 | 9,915,173 |
| 1 week ago | 2026-07-16 | 88.7 | 11,335,147 | 8,795,353 | 9,915,173 |
| 1 month ago | 2026-06-23 | 89.3 | 11,518,307 | 8,857,090 | 9,915,173 |
| 3 months ago | 2026-04-23 | 86.7 | 10,822,482 | 8,576,918 | 9,887,970 |
| 6 months ago | 2026-01-23 | 84.1 | 10,484,316 | 8,317,592 | 9,887,970 |
| 1 year ago | 2025-07-23 | 94.5 | 11,903,428 | 9,374,270 | 9,915,173 |
*
Percent Full is based on Conservation Storage and Conservation Capacity and doesn't account for storage in flood pool.
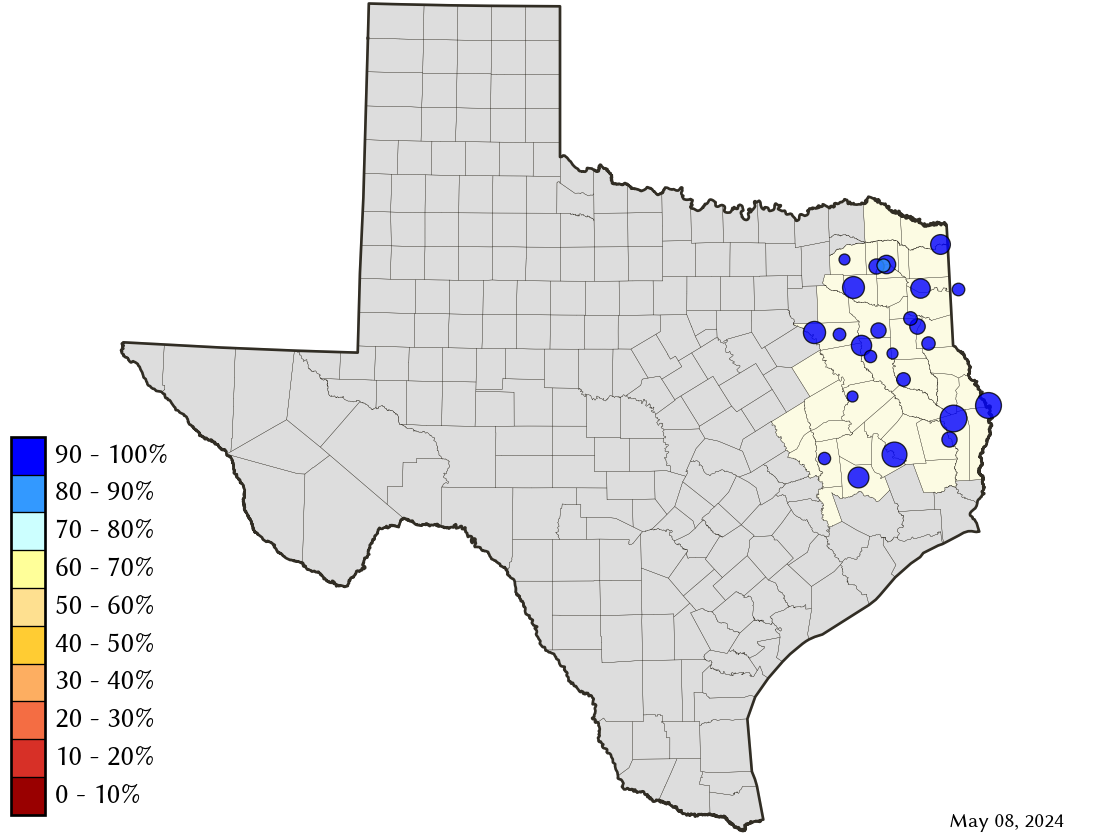
Area Map
Reservoir Storage
| Reservoir | Type | Percent Full |
Water Level (ft) |
Height Above Conservation Pool (ft) |
Reservoir Storage (acre-ft) |
Conservation Storage (acre-ft) |
Conservation Capacity (acre-ft) |
Surface Area (acres) |
|---|---|---|---|---|---|---|---|---|
| Athens |

|
99.3 | 439.89 | -0.11 | 29,341 | 29,300 | 29,503 | 1,791 |
| B A Steinhagen |
|
94.9 | 82.65 | -0.35 | 65,735 | 65,662 | 69,186 | 9,913 |
| Bob Sandlin |
|
95.7 | 336.55 | -0.95 | 194,792 | 184,061 | 192,417 | 8,703 |
| Caddo 1 |
|
100.0 | 168.80 | 0.30 | 135,362 | 29,898 | 29,898 | 27,389 |
| Cedar Creek |
|
83.5 | 318.56 | -3.44 | 538,174 | 538,075 | 644,686 | 29,459 |
| Cherokee |
|
99.5 | 279.84 | -0.16 | 44,270 | 39,888 | 40,094 | 3,723 |
| Conroe |
|
99.9 | 200.98 | -0.02 | 417,207 | 417,180 | 417,577 | 19,884 |
| Cypress Springs |
|
97.0 | 377.38 | -0.62 | 64,766 | 64,766 | 66,756 | 3,187 |
| Fork |
|
89.1 | 400.44 | -2.56 | 571,672 | 540,229 | 606,088 | 24,563 |
| Gibbons Creek |
|
98.0 | 246.80 | -0.20 | 26,917 | 25,213 | 25,721 | 2,531 |
| Houston County |
|
99.9 | 259.99 | -0.01 | 17,652 | 17,100 | 17,113 | 1,326 |
| Jacksonville |
|
99.9 | 421.98 | -0.02 | 25,709 | 25,647 | 25,670 | 1,163 |
| Lake O' the Pines |

|
94.3 | 229.17 | -0.83 | 253,328 | 253,328 | 268,566 | - n.a. - |
| Livingston |
|
100.0 | 131.08 | 0.08 | 1,609,736 | 1,603,504 | 1,603,504 | 78,076 |
| Martin |
|
94.3 | 305.11 | -0.89 | 71,389 | 71,389 | 75,726 | 4,792 |
| Monticello |
|
80.4 | 336.37 | -3.63 | 27,924 | 27,924 | 34,740 | 1,673 |
| Murvaul |
|
98.3 | 265.11 | -0.19 | 37,635 | 37,635 | 38,285 | 3,410 |
| Nacogdoches |
|
94.4 | 277.96 | -1.04 | 37,303 | 37,301 | 39,522 | 2,087 |
| Palestine |
|
97.9 | 344.67 | -0.33 | 359,735 | 359,726 | 367,303 | 22,817 |
| Sam Rayburn |
|
72.6 | 156.80 | -7.60 | 2,094,508 | 2,075,552 | 2,857,077 | 91,384 |
| Striker |
|
94.2 | 292.49 | -0.51 | 20,813 | 15,891 | 16,878 | 1,917 |
| Sulphur Springs |
|
100.0 | 459.08 | 0.13 | 17,998 | 17,747 | 17,747 | - n.a. - |
| Toledo Bend 2 |
|
93.8 | 170.30 | -1.70 | 4,200,573 | 2,098,236 | 2,236,450 | 174,272 |
| Tyler |
|
98.2 | 375.10 | -0.28 | 75,973 | 70,762 | 72,073 | 4,649 |
| Wright Patman |
|
100.0 | 227.14 | 6.54 | 298,319 | 122,593 | 122,593 | - n.a. - |
footnotes
1
Caddo Lake straddles the border of Texas and Louisiana, Texas has rights to 50% of Lake Caddo's total conservation capacity. Percent full, conservation storage and conservation capacity are based on the Texas share.
2
Toledo Bend Reservoir straddles the border of Texas and Louisiana, Texas has rights to 50% of Toledo Bend Reservoir's total conservation capacity. Percent full, conservation storage and conservation capacity are based on the Texas share.