Austin Area Reservoirs: Monitored Water Supply Reservoirs are 99.8% full on 2026-07-23
Historical Data
| Date | Percent Full |
Reservoir Storage (acre-ft) |
Conservation Storage (acre-ft) |
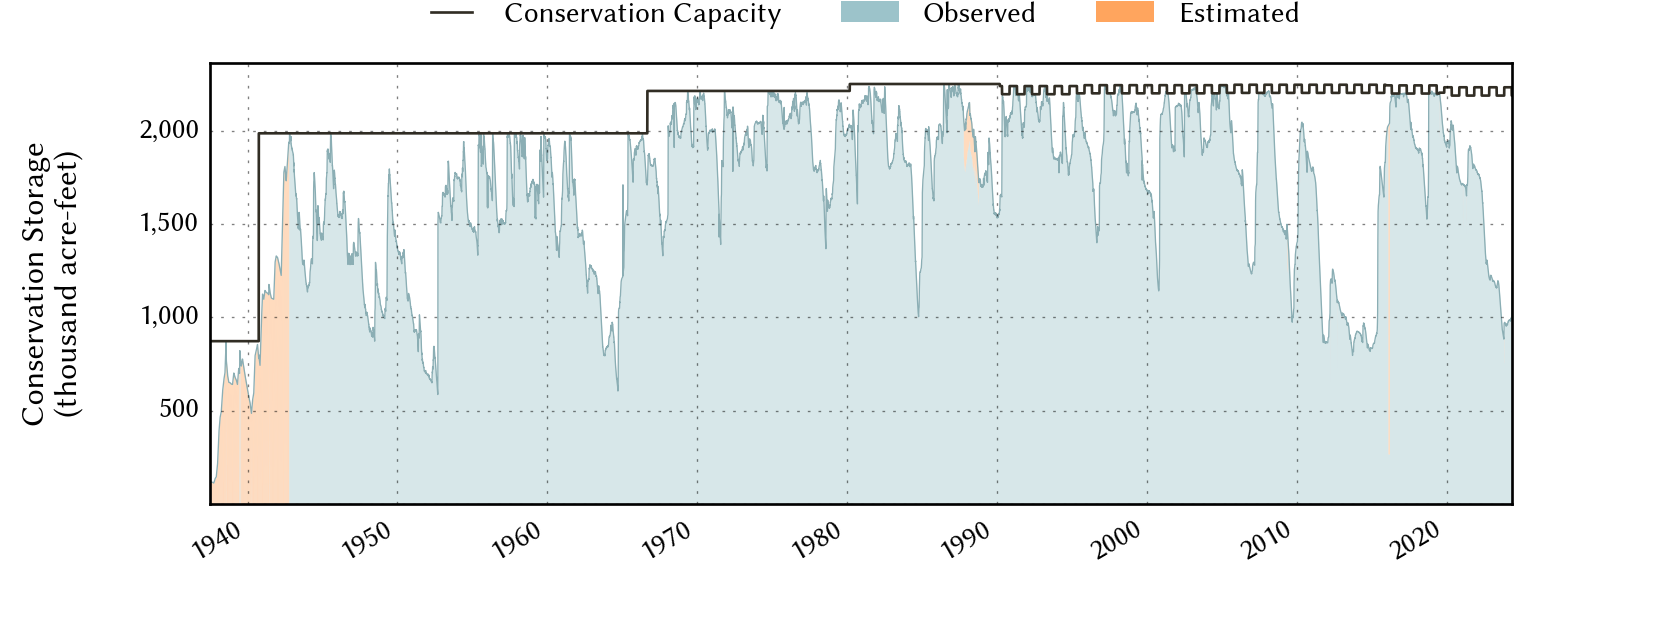
Conservation Capacity (acre-ft) |
|
|---|---|---|---|---|---|
| Today | 2026-07-23 | 99.8 | 2,300,545 | 2,227,158 | 2,232,539 |
| Yesterday | 2026-07-22 | 99.8 | 2,305,262 | 2,227,606 | 2,232,539 |
| 2 days ago | 2026-07-21 | 99.8 | 2,318,172 | 2,228,278 | 2,232,539 |
| 1 week ago | 2026-07-16 | 92.4 | 2,106,565 | 2,063,148 | 2,232,539 |
| 1 month ago | 2026-06-23 | 93.2 | 2,132,073 | 2,079,695 | 2,232,539 |
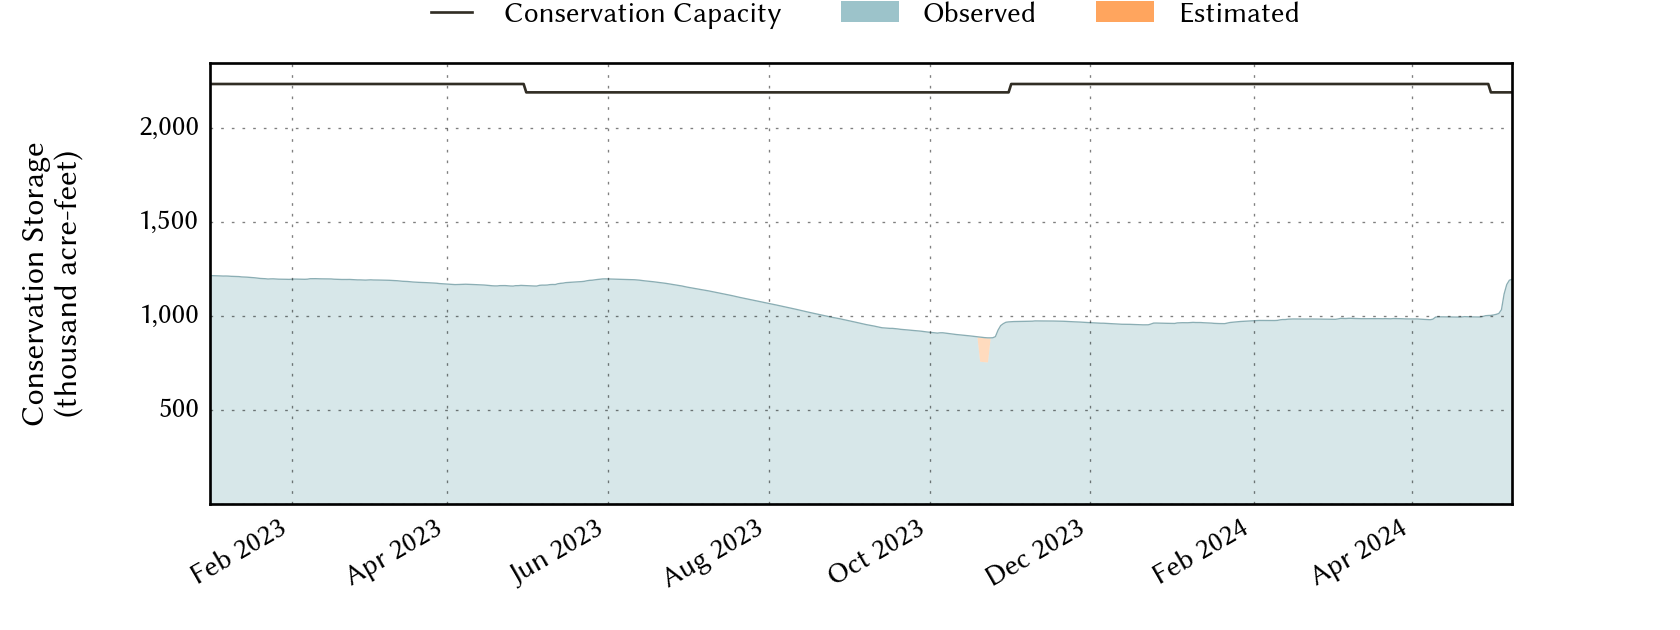
| 3 months ago | 2026-04-23 | 84.9 | 1,926,317 | 1,895,474 | 2,232,539 |
| 6 months ago | 2026-01-23 | 85.6 | 1,942,374 | 1,911,531 | 2,232,539 |
| 1 year ago | 2025-07-23 | 95.3 | 2,208,318 | 2,126,704 | 2,232,539 |
*
Percent Full is based on Conservation Storage and Conservation Capacity and doesn't account for storage in flood pool.
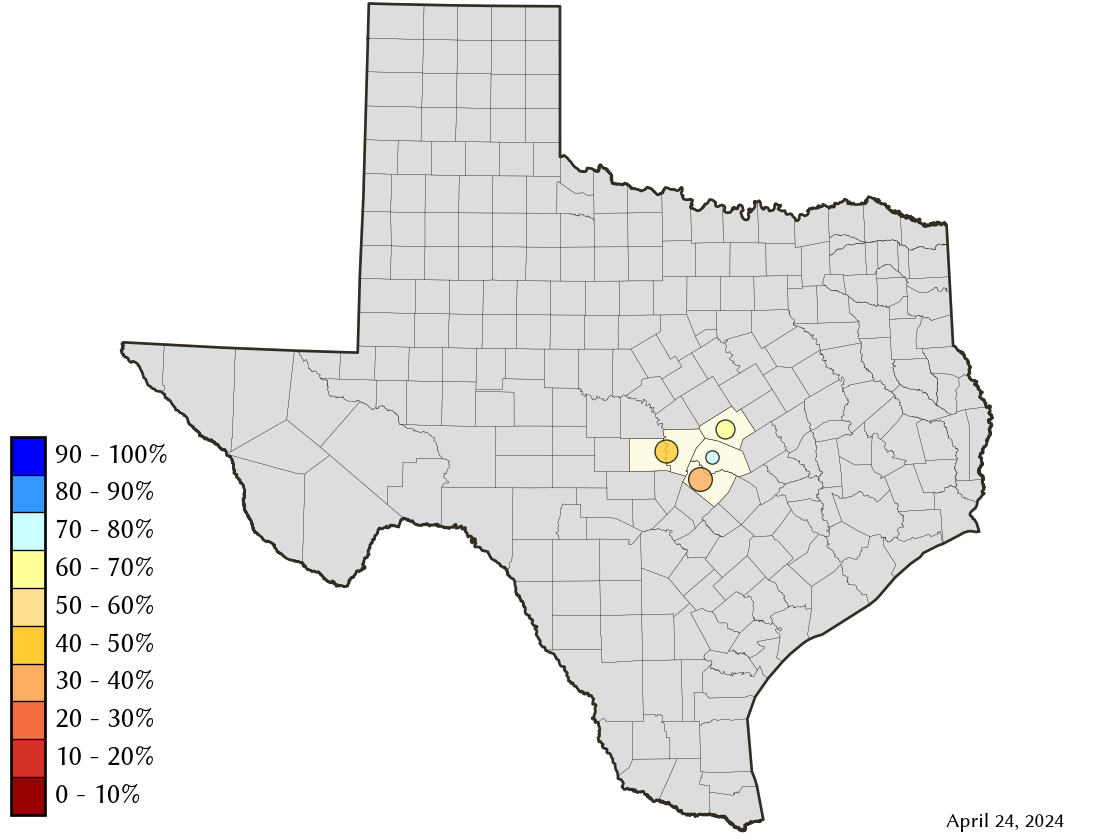
Area Map
Reservoir Storage
| Reservoir | Type | Percent Full |
Water Level (ft) |
Height Above Conservation Pool (ft) |
Reservoir Storage (acre-ft) |
Conservation Storage (acre-ft) |
Conservation Capacity (acre-ft) |
Surface Area (acres) |
|---|---|---|---|---|---|---|---|---|
| Buchanan |

|
99.4 | 1,019.76 | -0.24 | 874,975 | 861,313 | 866,694 | 22,396 |
| Georgetown |

|
100.0 | 792.27 | 1.27 | 39,753 | 38,005 | 38,005 | - n.a. - |
| Stillhouse Hollow |
|
100.0 | 623.16 | 1.16 | 237,437 | 229,796 | 229,796 | - n.a. - |
| Travis |
|
100.0 | 682.73 | 1.73 | 1,148,380 | 1,098,044 | 1,098,044 | 19,461 |