North-East-Texas Planning Region Reservoirs: Monitored Water Supply Reservoirs are 94.1% full on 2026-07-27
Historical Data
| Date | Percent Full |
Reservoir Storage (acre-ft) |
Conservation Storage (acre-ft) |
Conservation Capacity (acre-ft) |
|
|---|---|---|---|---|---|
| Today | 2026-07-27 | 94.1 | 2,800,257 | 2,439,307 | 2,592,091 |
| Yesterday | 2026-07-26 | 94.2 | 2,803,882 | 2,441,369 | 2,592,091 |
| 2 days ago | 2026-07-25 | 94.3 | 2,809,604 | 2,444,648 | 2,592,091 |
| 1 week ago | 2026-07-20 | 94.9 | 2,844,935 | 2,460,641 | 2,592,091 |
| 1 month ago | 2026-06-27 | 95.9 | 3,063,771 | 2,487,053 | 2,592,091 |
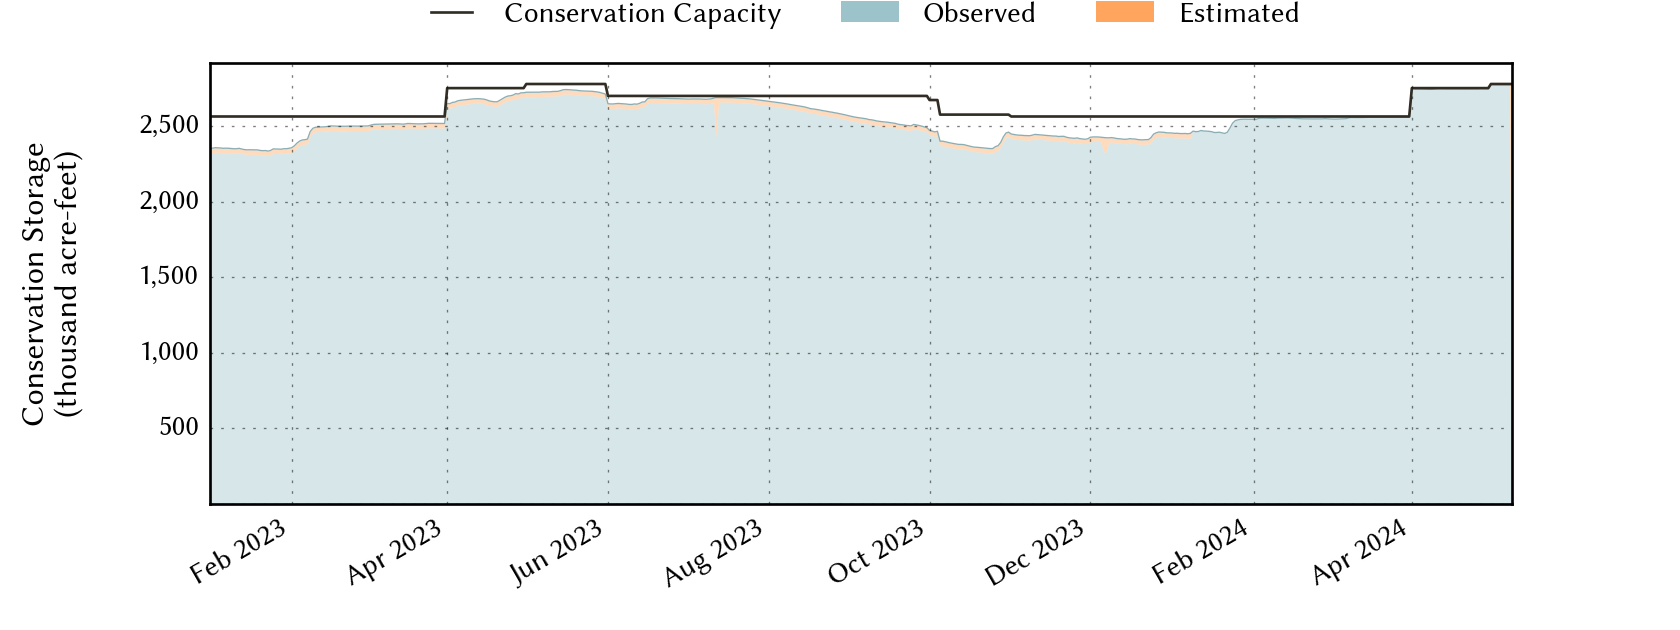
| 3 months ago | 2026-04-27 | 94.1 | 2,670,750 | 2,413,005 | 2,564,888 |
| 6 months ago | 2026-01-27 | 89.6 | 2,562,109 | 2,298,611 | 2,564,888 |
| 1 year ago | 2025-07-27 | 99.3 | 2,934,258 | 2,574,925 | 2,592,091 |
*
Percent Full is based on Conservation Storage and Conservation Capacity and doesn't account for storage in flood pool.
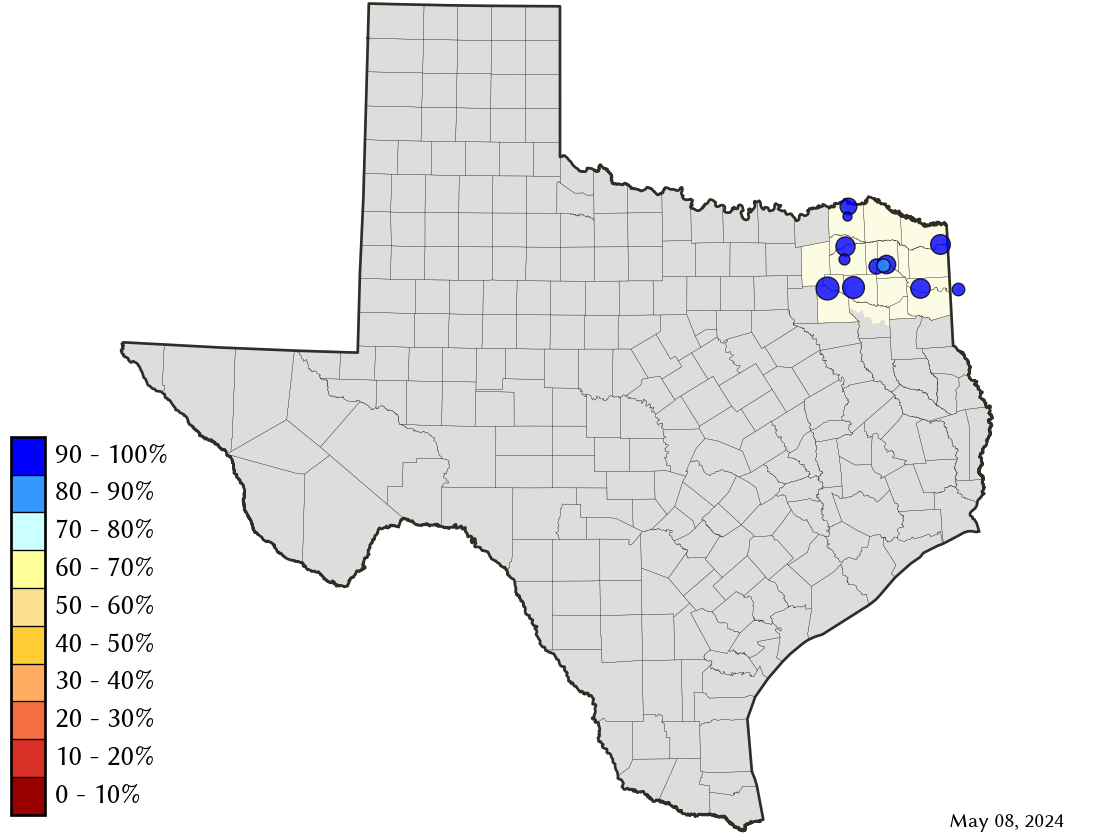
Area Map
Reservoir Storage
| Reservoir | Type | Percent Full |
Water Level (ft) |
Height Above Conservation Pool (ft) |
Reservoir Storage (acre-ft) |
Conservation Storage (acre-ft) |
Conservation Capacity (acre-ft) |
Surface Area (acres) |
|---|---|---|---|---|---|---|---|---|
| Bob Sandlin |

|
95.3 | 336.47 | -1.03 | 194,096 | 183,365 | 192,417 | 8,687 |
| Caddo 1 |
|
100.0 | 168.71 | 0.21 | 133,224 | 29,898 | 29,898 | 27,197 |
| Crook |
|
97.8 | 475.81 | -0.19 | 9,012 | 8,997 | 9,195 | 1,043 |
| Cypress Springs |
|
96.6 | 377.29 | -0.71 | 64,479 | 64,479 | 66,756 | 3,180 |
| Fork |
|
88.5 | 400.28 | -2.72 | 567,754 | 536,311 | 606,088 | 24,418 |
| Jim Chapman |

|
85.6 | 437.85 | -2.15 | 257,132 | 221,357 | 258,723 | 16,761 |
| Lake O' the Pines |
|
93.7 | 229.08 | -0.92 | 251,703 | 251,703 | 268,566 | - n.a. - |
| Monticello |
|
80.0 | 336.30 | -3.70 | 27,804 | 27,804 | 34,740 | 1,666 |
| Pat Mayse |
|
100.0 | 451.36 | 0.36 | 119,880 | 113,683 | 113,683 | - n.a. - |
| Sulphur Springs |
|
100.0 | 458.98 | 0.03 | 17,802 | 17,747 | 17,747 | - n.a. - |
| Tawakoni |
|
98.8 | 437.22 | -0.28 | 861,378 | 861,370 | 871,685 | 36,666 |
| Wright Patman |
|
100.0 | 227.07 | 6.47 | 295,993 | 122,593 | 122,593 | - n.a. - |
footnotes
1
Caddo Lake straddles the border of Texas and Louisiana, Texas has rights to 50% of Lake Caddo's total conservation capacity. Percent full, conservation storage and conservation capacity are based on the Texas share.