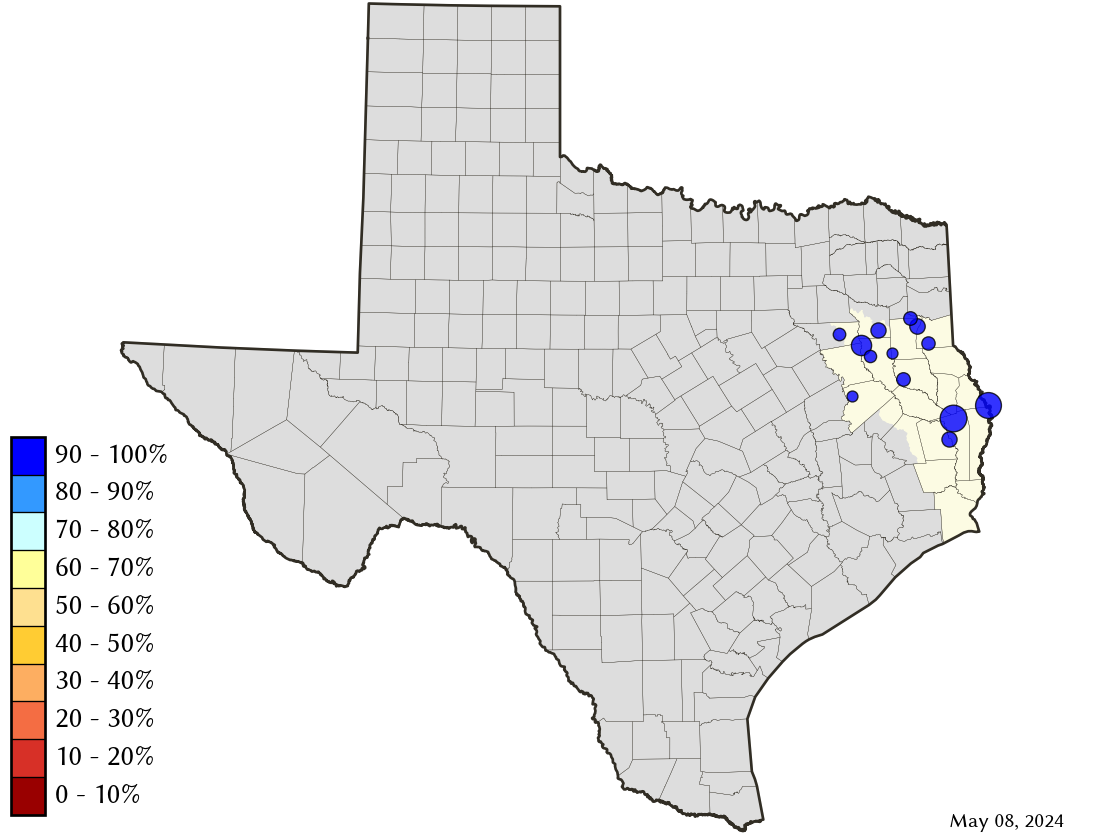
East-Texas Planning Region Reservoirs: Monitored Water Supply Reservoirs are 82.9% full on 2026-07-31
Historical Data
| Date | Percent Full |
Reservoir Storage (acre-ft) |
Conservation Storage (acre-ft) |
Conservation Capacity (acre-ft) |
|
|---|---|---|---|---|---|
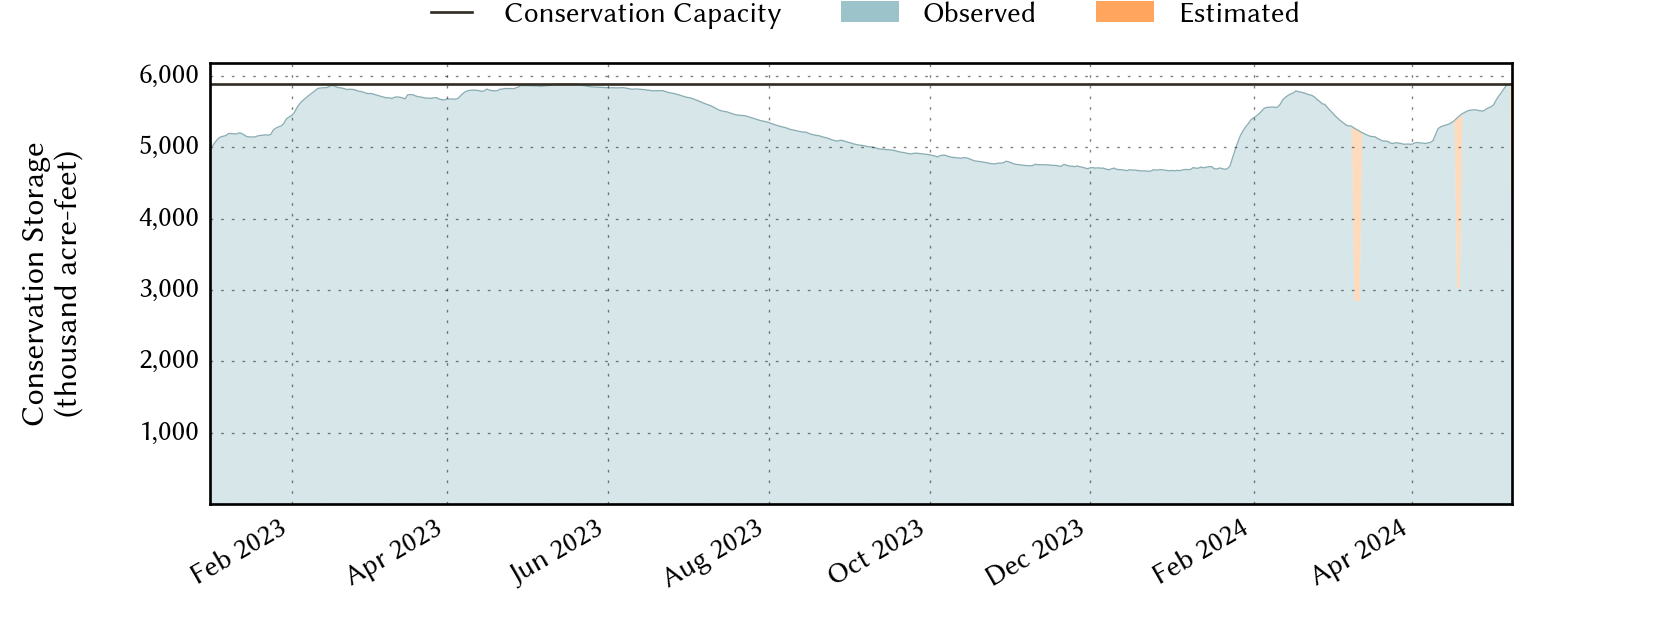
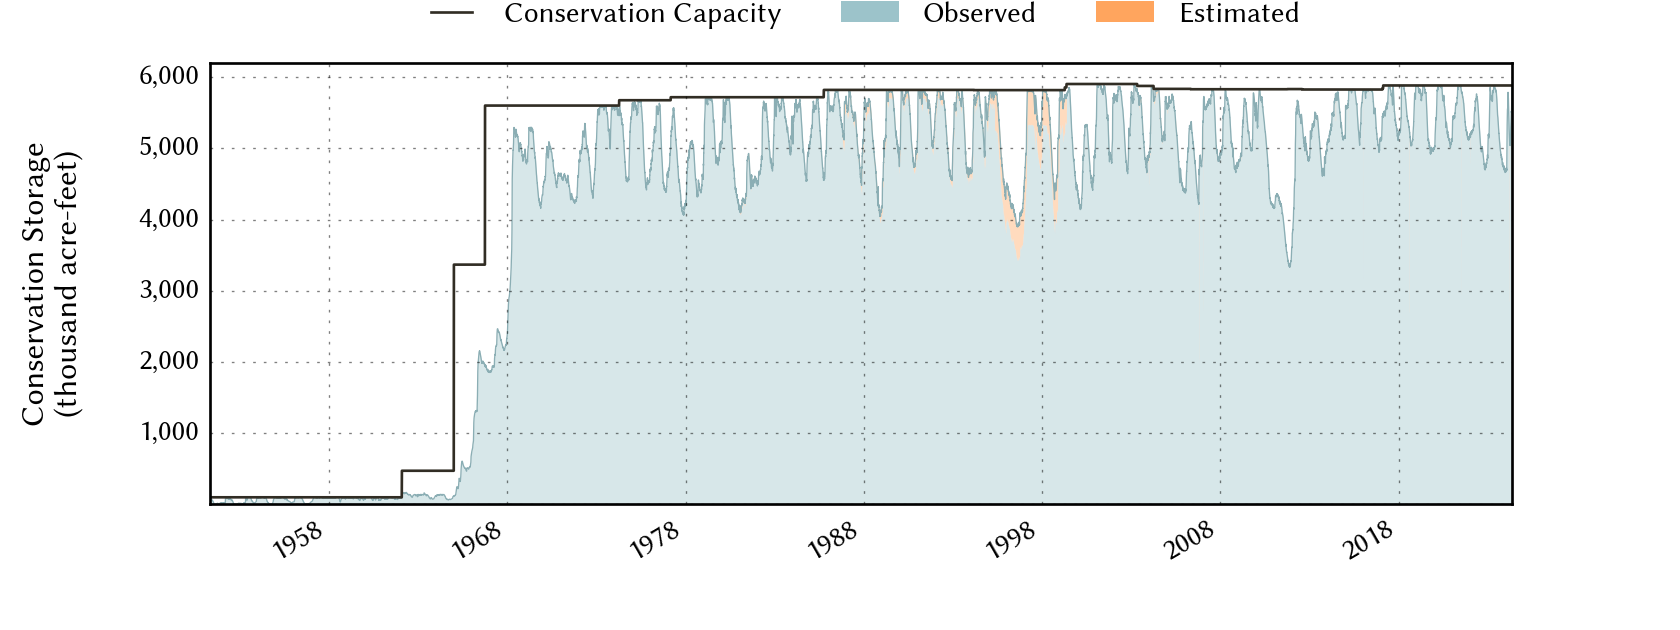
| Today | 2026-07-31 | 82.9 | 6,976,050 | 4,876,539 | 5,884,880 |
| Yesterday | 2026-07-30 | 83.0 | 6,985,060 | 4,882,178 | 5,884,880 |
| 2 days ago | 2026-07-29 | 83.1 | 6,998,093 | 4,890,212 | 5,884,880 |
| 1 week ago | 2026-07-24 | 83.6 | 7,041,281 | 4,921,051 | 5,884,880 |
| 1 month ago | 2026-06-30 | 84.7 | 7,154,926 | 4,985,591 | 5,884,880 |
| 3 months ago | 2026-04-30 | 81.8 | 6,860,820 | 4,813,670 | 5,884,880 |
| 6 months ago | 2026-01-31 | 77.6 | 6,502,415 | 4,569,601 | 5,884,880 |
| 1 year ago | 2025-07-31 | 86.6 | 7,232,783 | 5,095,132 | 5,884,880 |
*
Percent Full is based on Conservation Storage and Conservation Capacity and doesn't account for storage in flood pool.
Area Map
Reservoir Storage
| Reservoir | Type | Percent Full |
Water Level (ft) |
Height Above Conservation Pool (ft) |
Reservoir Storage (acre-ft) |
Conservation Storage (acre-ft) |
Conservation Capacity (acre-ft) |
Surface Area (acres) |
|---|---|---|---|---|---|---|---|---|
| Athens |

|
98.0 | 439.68 | -0.32 | 28,957 | 28,916 | 29,503 | 1,768 |
| B A Steinhagen |
|
97.2 | 82.81 | -0.19 | 67,332 | 67,259 | 69,186 | 10,060 |
| Cherokee |
|
96.9 | 279.56 | -0.44 | 43,246 | 38,864 | 40,094 | 3,593 |
| Houston County |
|
98.8 | 259.84 | -0.16 | 17,459 | 16,907 | 17,113 | 1,285 |
| Jacksonville |
|
98.9 | 421.75 | -0.25 | 25,443 | 25,381 | 25,670 | 1,152 |
| Martin |
|
92.3 | 304.79 | -1.21 | 69,865 | 69,865 | 75,726 | 4,734 |
| Murvaul |
|
96.7 | 264.93 | -0.37 | 37,023 | 37,023 | 38,285 | 3,389 |
| Nacogdoches |
|
92.9 | 277.68 | -1.32 | 36,722 | 36,720 | 39,522 | 2,063 |
| Palestine |
|
96.3 | 344.41 | -0.59 | 353,832 | 353,823 | 367,303 | 22,585 |
| Sam Rayburn |

|
71.9 | 156.58 | -7.82 | 2,074,487 | 2,055,531 | 2,857,077 | 90,649 |
| Striker |
|
91.8 | 292.28 | -0.72 | 20,411 | 15,489 | 16,878 | 1,904 |
| Toledo Bend 1 |
|
92.2 | 169.85 | -2.15 | 4,126,502 | 2,061,201 | 2,236,450 | 172,115 |
| Tyler |
|
96.5 | 374.84 | -0.54 | 74,771 | 69,560 | 72,073 | 4,593 |
footnotes
1
Toledo Bend Reservoir straddles the border of Texas and Louisiana, Texas has rights to 50% of Toledo Bend Reservoir's total conservation capacity. Percent full, conservation storage and conservation capacity are based on the Texas share.