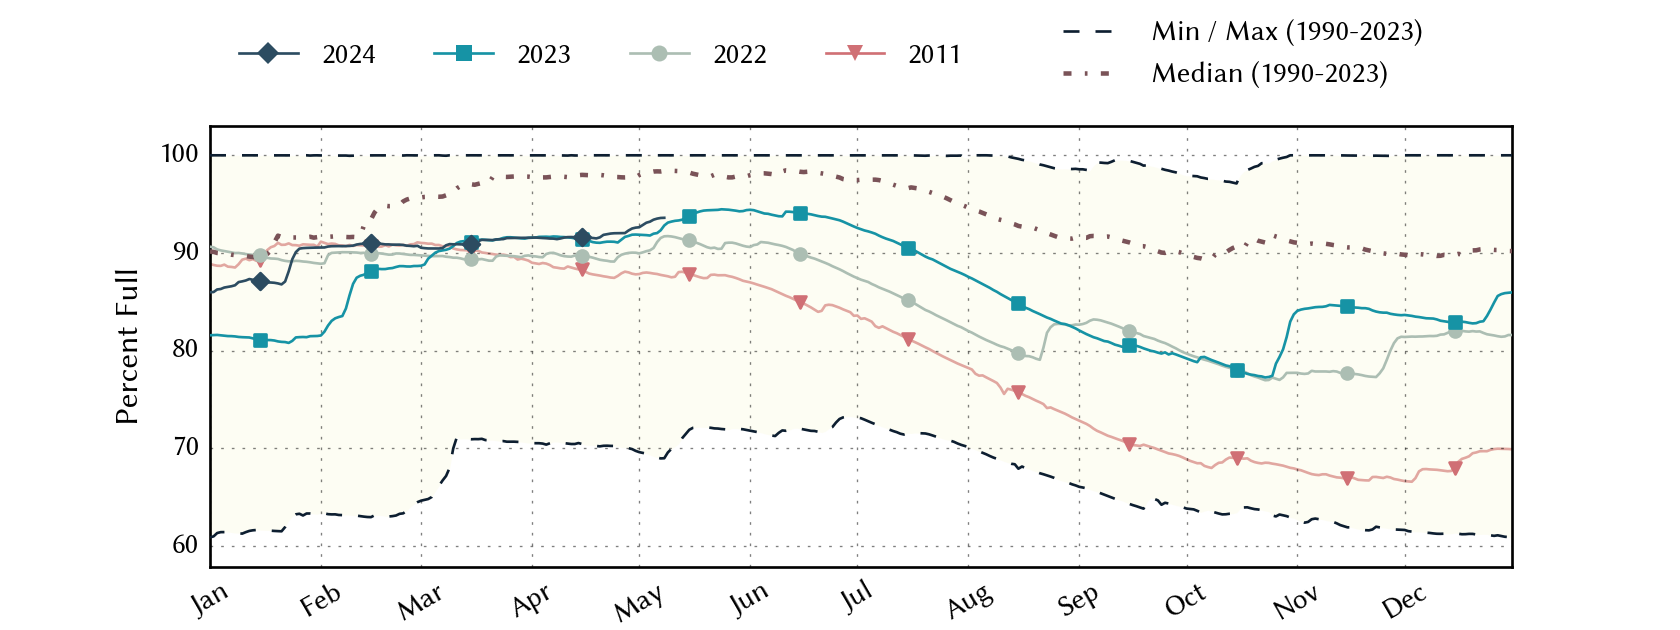
Fort Worth Area Reservoirs: Monitored Water Supply Reservoirs are 89.3% full on 2026-07-28
Historical Data
| Date | Percent Full |
Reservoir Storage (acre-ft) |
Conservation Storage (acre-ft) |
Conservation Capacity (acre-ft) |
|
|---|---|---|---|---|---|
| Today | 2026-07-28 | 89.3 | 2,225,221 | 2,190,231 | 2,451,597 |
| Yesterday | 2026-07-27 | 89.5 | 2,228,520 | 2,193,530 | 2,451,597 |
| 2 days ago | 2026-07-26 | 89.6 | 2,232,472 | 2,197,482 | 2,451,597 |
| 1 week ago | 2026-07-21 | 90.4 | 2,251,741 | 2,216,751 | 2,451,597 |
| 1 month ago | 2026-06-28 | 91.6 | 2,281,453 | 2,246,463 | 2,451,597 |
| 3 months ago | 2026-04-28 | 89.4 | 2,226,951 | 2,191,961 | 2,451,597 |
| 6 months ago | 2026-01-28 | 87.6 | 2,181,569 | 2,146,579 | 2,451,597 |
| 1 year ago | 2025-07-28 | 98.4 | 2,448,913 | 2,411,882 | 2,451,597 |
*
Percent Full is based on Conservation Storage and Conservation Capacity and doesn't account for storage in flood pool.
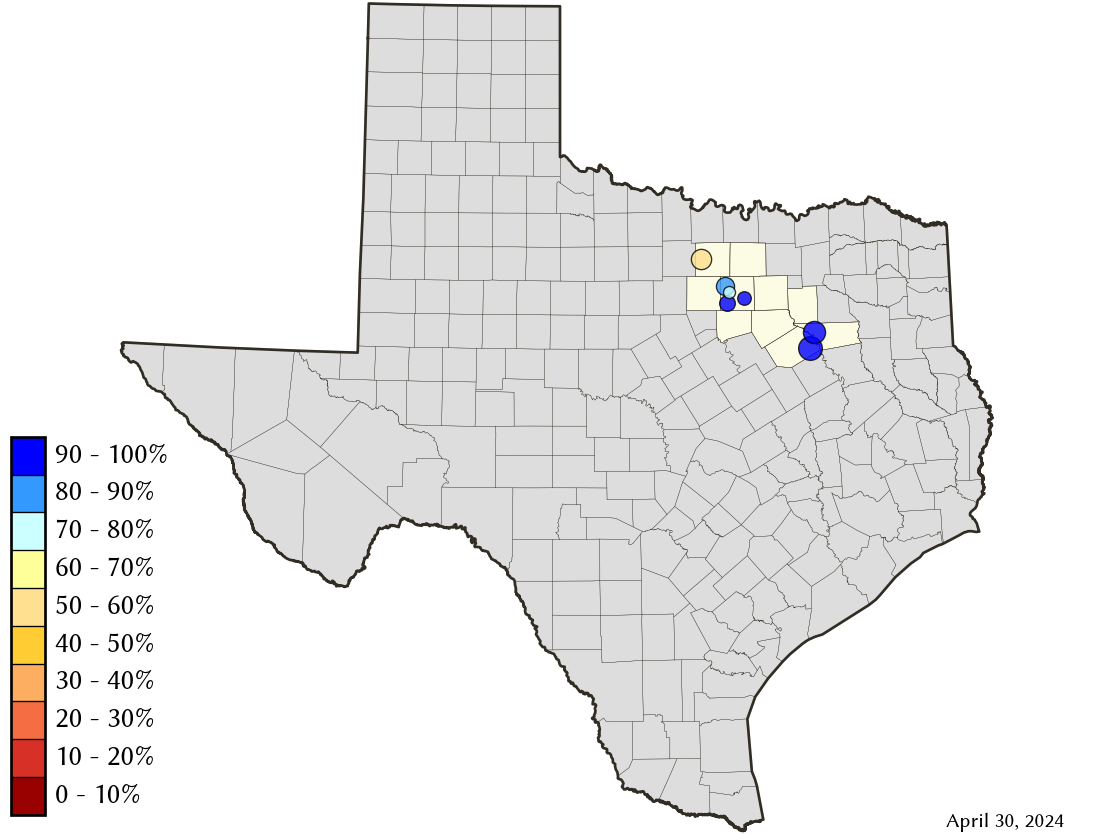
Area Map
Reservoir Storage
| Reservoir | Type | Percent Full |
Water Level (ft) |
Height Above Conservation Pool (ft) |
Reservoir Storage (acre-ft) |
Conservation Storage (acre-ft) |
Conservation Capacity (acre-ft) |
Surface Area (acres) |
|---|---|---|---|---|---|---|---|---|
| Arlington |

|
85.7 | 546.96 | -3.04 | 34,452 | 34,420 | 40,157 | 1,856 |
| Benbrook |

|
93.1 | 692.34 | -1.66 | 79,709 | 79,709 | 85,648 | 3,493 |
| Bridgeport |
|
84.2 | 830.96 | -5.04 | 313,202 | 313,202 | 372,183 | 11,161 |
| Cedar Creek |
|
82.3 | 318.30 | -3.70 | 530,544 | 530,445 | 644,686 | 29,223 |
| Eagle Mountain |
|
85.2 | 645.96 | -3.14 | 157,620 | 157,620 | 185,087 | 8,307 |
| Richland-Chambers |
|
96.0 | 314.00 | -1.00 | 1,081,725 | 1,055,942 | 1,099,417 | 43,075 |
| Worth |
|
77.4 | 592.34 | -1.66 | 27,969 | 18,893 | 24,419 | 3,229 |